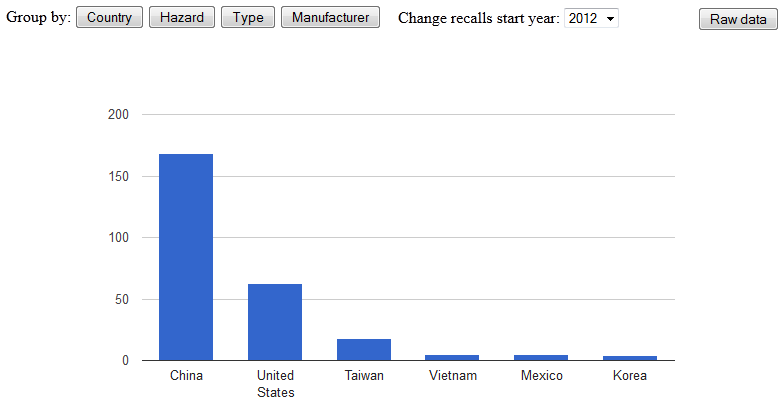
The Consumer Product Safety Commission (http://www.cpsc.gov/) collects and publishes information about product recalls. The department made its database of recalls information available to the public as a web service, which means we can have fun with this data… Leveraging our html5 dashboarding framework, I created a dashboard that consumes the web service (allows user to select start year for the recalls data) and aggregates the number of recalls based on user selected attributes (like country or manufacturer). The chart display shows categories that had 4 or more recalls in the selected time frame, the Raw Data view dumps the entire data set on the screen. This is interesting stuff.. Enjoy!
-
Archives
- October 2021
- June 2020
- June 2017
- March 2017
- September 2016
- June 2016
- February 2016
- November 2015
- July 2015
- May 2015
- March 2015
- January 2015
- September 2014
- August 2014
- July 2014
- June 2014
- March 2014
- February 2014
- January 2014
- December 2013
- October 2013
- August 2013
- July 2013
- June 2013
- April 2013
- March 2013
- February 2013
- December 2012
- November 2012
- October 2012
- September 2012
- August 2012
- July 2012
- June 2012
- May 2012
- April 2012
- March 2012
- February 2012
- January 2012
- December 2011
- November 2011
- October 2011
- September 2011
- August 2011
- July 2011
- June 2011
- May 2011
- April 2011
- March 2011
- February 2011
- January 2011
-
Meta

