
SAP made some significant improvements in the Web Intelligence reporting tool with the release of the latest version of their BI stack, 4.0. One of the improvements is the addition of several new chart types, and overall improvements in the charts data visualization quality. As an example, i tried to use the new webi bubble chart and was pleased to be able to produce a good presentation of one of my favorite charts/visualizations: a magic quadrant. The magic quadrant was made famous by Gartner who typically plots various vendors across four quadrants representing the marketplace. This is a very effective way to visualize and quickly understand the relative position of different entities in a complex environment. To improve on this visualization, the bubble chart also allows you to use the bubble size to represent an additional piece of information, so that even within each quadrant you can further grasp very quickly and effectively the position of entities in relation to each other. It’s a great way to represent many business domains, such as sales pipeline, financial information or HR data. In this example, i used the e-Fashion sample database to plot revenues, quantities and margins for states. You can find the .wid file here.
Typically, though, there is a problem with colors. I see only four or maybe five easily distinguishable colors. It’s hard to tell Texas vs. Florida or California vs. New York. Does WebI have the option of using labels, like Gartner?
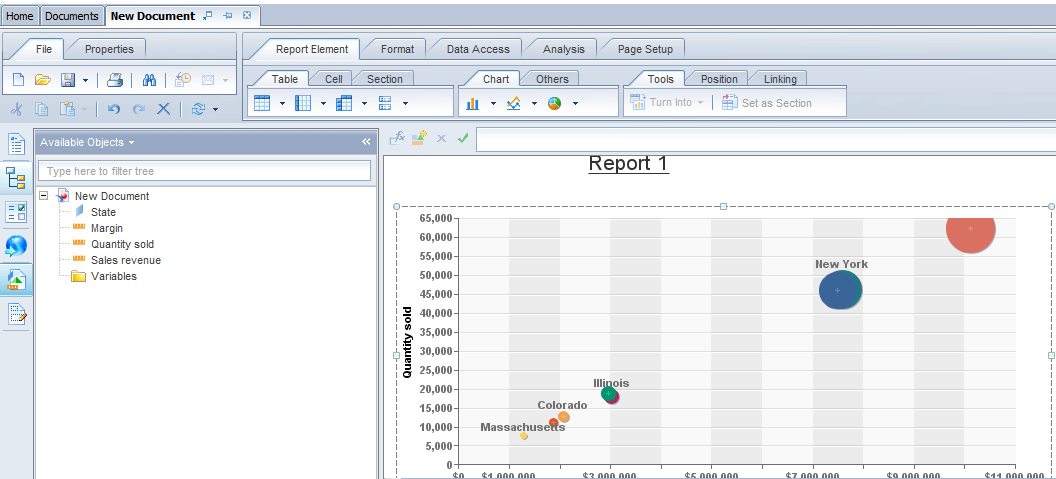
Larry, great point, and yes, you can display the labels on the bubbles, instead of the legend. Here’s a quick example: