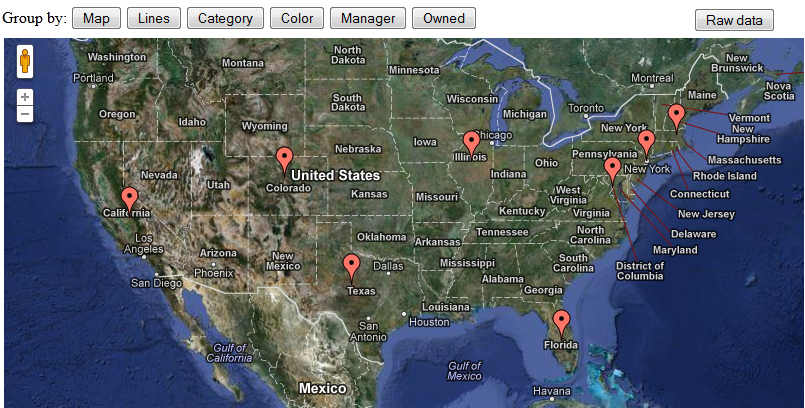
One of the great features about the google visualization api we use in our html5 dashboards, is the ability to perform client side, run time group by operations. Unlike Xcelsius, which does not provide this functionality, this ability allows us to get all the data we need in one trip to the server, and then using group by aggregate the detailed data in different levels for different presentation needs. In the example below, i got some sample data (from eFashion…) and am using different group by options to aggregate the measurements, revenue and margin, by different dimensions in the dataset. All the data is retrieved from the database once, when the page loads, and the rest of the magic happens in the browser memory, no server calls involved. This example also includes the ability to toggle the chart presentation with a map, and the ability to view the full data set (all 4715 rows of it). Enjoy.
-
Archives
- October 2021
- June 2020
- June 2017
- March 2017
- September 2016
- June 2016
- February 2016
- November 2015
- July 2015
- May 2015
- March 2015
- January 2015
- September 2014
- August 2014
- July 2014
- June 2014
- March 2014
- February 2014
- January 2014
- December 2013
- October 2013
- August 2013
- July 2013
- June 2013
- April 2013
- March 2013
- February 2013
- December 2012
- November 2012
- October 2012
- September 2012
- August 2012
- July 2012
- June 2012
- May 2012
- April 2012
- March 2012
- February 2012
- January 2012
- December 2011
- November 2011
- October 2011
- September 2011
- August 2011
- July 2011
- June 2011
- May 2011
- April 2011
- March 2011
- February 2011
- January 2011
-
Meta


This is awesome!!!!!!!!!
Especially the highlights happens when the mouse moveover on the legends & the transition effects. Can you send me the source file to explore this logic.
Eagerly waiting!!!!
Susan, thank you! The client side code is all JS, so you can simply select view source on the page in your browser, and you have it all. There is a little php code there to do the server side database fetch, i will look to post that sometime soon..