SAP Dashboards (Xcelsius) autocomplete input text

Autocomplete has become a standard in modern application, when users are asked to type in inputs. In the example below, I implemented autocomplete functionality into an Xcelsius input text component. Start typing any zip code starting with 0 and hit the enter key to get the all the zip codes that match the starting numbers you typed in. (zip code list sourced from http://www.quine.org/zip-all-00001.html, not all zip codes represented, and accuracy of list is unknown)

To get this to work, I used an ajax technique. The Xcelsius file contains two eic variables, one for the value inserted in the text box, and one for the query results array presented in the spreadsheet component. The html page that embeds the swf contains a javascript functions that listens to changes in the value of the input eic. On change, it makes a call to a php file that uses the user input as part of a sql where clause, and gets the list of matching zip codes from a mySql database.
Since there are no native inpu text components in Xcelsius that write to the model while users type, users still need hit enter; ce la vie. Also, I limit the query results to 100 rows from the database, so you don’t get all 5600 zip codes that start with 0 as you type 0 and hit enter…
Using BusinessObjects native connectivity methods, such as BI Services, QaaWS or Live Office can eliminate the need for the ajax approach and basically trigger connections on change from within Xcelsius. All the source files for this example can be found here. Enjoy!

Posted in Xcelsius | Tagged | 5 Comments

BI Services Run Time Configuration Explained

SAP BusinessObjects BI Services are a class of web services that can be easily created by converting web intelligence (webi) report blocks into web services. A simple GUI wizard guides the report developer through a few simple steps that publish the report block as a web service and provide a WSDL that can be used to interact with the report block data. As i wrote in an older post, the BI Services combine the power of Live Office in leveraging webi full capabilities (using variables, filters, formulas, cross tabs, etc) with the power of QaaWS web services (good caching capabilities for enhanced performance).
The BI Services publish with two default methods. A GetReportBlock method and a Drill method. For this post, i will examine the GetReportBlock configuration and describe some of the refinements you can apply to the web service as you consume it in your application.
First, a word about the difference between prompts and filters: BI Services introduce a powerful concept of filters. Basically, any object in the report can be used as a filter in the web service. Filters can be applied at the database level during query time, or to a saved report instance data. Prompts are only applicable at the database level and cannot be applied to saved instances.
Next, there are two main input parameters that control the GetReportBlock behavior with regards to filtering and running against the DB vs running against saved reports instances: refresh and getFromLastDocumentInstance (or getFromUserInstance in “bursting” schedules scenarios). All these parameters are boolean types and setting them to true or false will result in different behavior from the web service during consumption time. Here are some example:
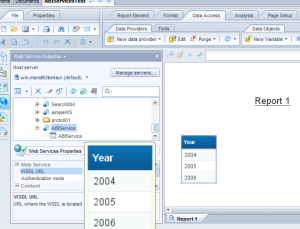
The initial setup is a simple report that returns the Years object from the e-Fashion universe. The report has an optional prompt on the Year object. The simple report block was published as a BI Service. When we run the report, it looks like so in webi:

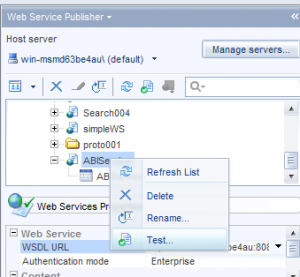
 We can test the web service configuration right from within webi

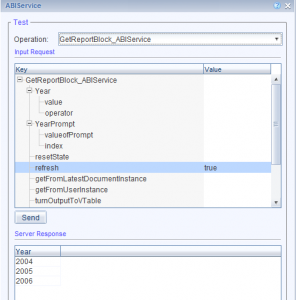
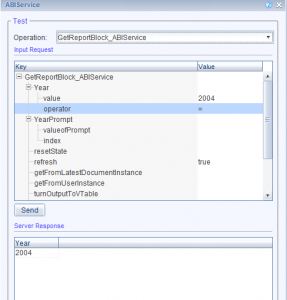
In our first test, we set the refresh parameter to true and send the request. This is because we set the report to refresh, we did not specify a prompt value, and since our prompt is optional, it was ignored, and we did not specify any filter value.

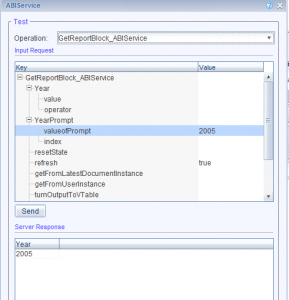
In the second test, we still use the refresh parameter to hit the database, but this time we specify a prompt value. We get back the year row we expect.


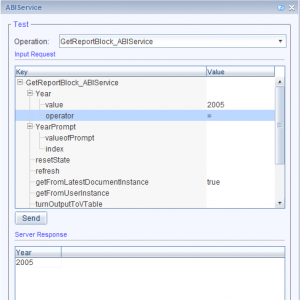
To demonstrate the interoperability of the filter and the prompt in a refresh scenario, we clear out the prompt value and use a filter that is set to equal a different year now.

Now, let’s try review what options are available when we schedule the report and save it with data. Let’s schedule our report with two years (rows) of data: 2004 and 2005.

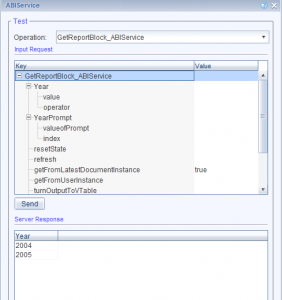
This time, when we go to test our web service, let’s use the saved report instance, and see what happens. First, let’s change our test settings to use the getFromLastDocumentInstance instead of refresh, and leave the filter value empty (since we are working with a saved instance, the prompt value will be ignored even we if we try to use it). This time, we will get the saved instance results, just two rows of data.

If we apply a filter for say, year 2005, we get the data from the report instance

We will not hit the database, so even if we try to filter for a value we know to exist in the DB, such as 2006, since we are only getting data from the saved report, we will not get any result back.


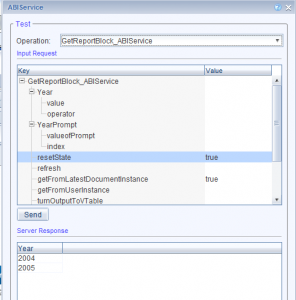
Also, if during testing you lose the state of your service between cached and non-cached versions, or need to reset the service state for any other reason, you can set the resetState parameter to true.

So all in all, the BI Services provide a lot of configuration options to address a wide range of reporting use cases from all saved data to no saved data used.

Posted in BusinessObjects 4.0, Web Intelligence, Xcelsius | Tagged , | 9 Comments

Draggable resizable popup in SAP Dashboards (Xcelsius)

One of the coolest tricks Xcelsius developers have been applying for years is the modal window trick. Using a background with partial transparency, and some nicely designed shades, it’s quite easy to create a popup modal window effect that is quite appealing. However, Xcelsius components are of course static in the sense that they cannot be moved across the canvas by the user, so these popups can be turned on or off. Well, what if you could popup a dialog that can be moved by the user across the screen…
By combining the capabilities of the label component in Xcelsius to call a javascript, and jquery ui dialog, you can accomplish just that. Click on the pop me link (html formatted  label component) to trigger the draggable dialog that contains another Xcelsius swf file. Enjoy all the source files here.

Posted in Xcelsius | Tagged , , | 2 Comments

Sorting out Oracle connectivity on BusinessObjects 4.0

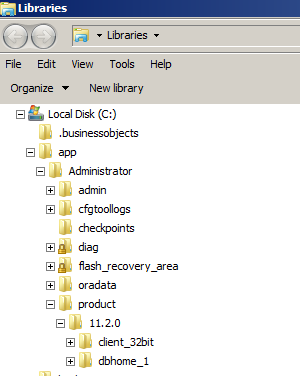
The new BusinessObjects 4.0 platform runs on 64bit OS. In an oracle based environment, this can be the source of much confusion.  While the platform itself (the CMS and Audit databases connections) support 64bit oracle driver connectivity, other BO tools do not. For example, the client tools, Universe designer or Crystal Reports 2011 are 32bit applications and will work only with 32bit versions of the oracle driver. So, what is one to do? Well, if you are looking to have the client tools installed on a server (in a development environment for example), or are deploying crystal reports that leverage oracle 32bit client connectivity, you will need to install both the 64bit and 32bit version of the driver on the machine, and in the same home. Once you get both clients installed and configured, you will be able to use applications that need 32bit middleware as well as applications that requires 64bit middleware.

In the example above, the 64bit client is installed into the dbhome_1 directory and the 32bit driver is installed in the client_32bit directory. Both are part of the same oracle home.
To keep things simple, make sure both clients share the same oracle home, as shown in the picture below, and make sure the tnsname.ora file is configured properly on both clients. To test your configuration, make sure you execute the tnsping.exe and/or sqlplus.exe commands from each directory separately to assure both clients are working properly and can connect to your database.

Posted in BusinessObjects 4.0 | Tagged , , , , | 7 Comments

What’s cooler than 500 rows in Xcelsius? 50,000 rows in Xcelsius!

Sap Dashboards (Xcelsius) certainly has its limitations. I will be the last one to argue otherwise. However, i often run into misconceptions about what those are exactly. A good example if the 500 rows limit. By default, Xcelsius is preconfigured out-of-the-box to limit cell bindings to 500 rows in the excel model. However, you can change this initial setting to your heart content. Why was this low limit set to begin with? Well, there are many reasons why you would see degraded performance in flash in general, and Xcelsius in particular, as you cram more functionality and data into your .swf file. The larger and more complex your .swf is, the more work your client computer has to do in order to manipulate and render the functionality desired, and to keep things simple, a 500 rows limit on most component seemed reasonable initially. As more sophisticated business intelligence applications are being built using Xcelsius, this limitation seems out of touch.
In the example below, you can click the Cool hyperlink to fire a javascript function that initialized an array with 500 values and passes it to Xceslius grid component (a list view) via an EIC connection. Or, you can click the Cooler hyperlink to fire the same function, but this time construct  a 50,000 values array and pass it to Xcelsius via EIC.


Does this mean you can have limitless dashboards with tens of thousands of rows of data in them? No, it does not, this is just an illustration to make a point. Realistically, your grid components should not exceed the low thousands if you are expecting good performance, and of course,  many parameters will go into the sizing considerations such as the number and kind of components you are using, the complexity of functionality, as expressed in your model, etc. You can find the sample files here.

Posted in Xcelsius | Tagged , , | 2 Comments

Webi enhancements in 4.0: dynamic chart titles and formula wildcard name searching

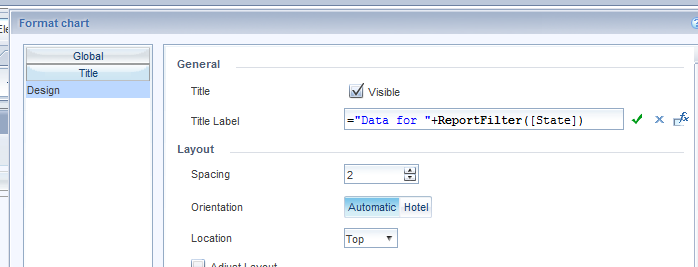
Web Intelligence has a lot of new features and capabilities that make life a lot easier for report developers. A couple that i ran across and thought were very useful are the ability to use a formula as a chart title and the ability to easily search for functions right in the formula builder in webi.
The first enhancement I mentioned above is long overdue and very helpful. In pre 4.0, webi charts could only be created with static titles. This could only be overcome by creating complex workarounds (like creating a single cell block with a formula, and using relative positioning to place it on top a chart to make it look like its title). Now, you can simply type the formula you want to use as the chart title. Nice.

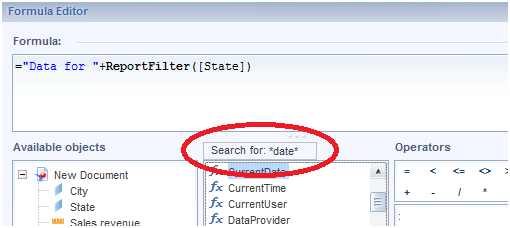
The second tip, helps report developers navigate the formulas library in webi. When you open the Formula Editor and select the Ctrl and F keys on your keyboard, you will get a little “Search for:” tooltip on top of the formulas list. You can use a * character as a varchar to search for any formula that contain the word date or format in its name..


Posted in Web Intelligence | Tagged , , , , | 5 Comments

Using EIC and z-index to coordinate and layer multiple SAP Dashboards (Xcelsius) swf files

Every Xcelsius developer who has any significant real life experience with the tool, knows that one of the greatest challenges of this technology is its scalability. As users get excited about the speed in which new developments can be incorporated to their dashboard application, and imaginations soar, XLF and SWF files become bloated with functionality very quickly, making it virtually impossible  to continue adding new features. Performance slows to a grind, and maintenance becomes very difficult as individual XLF files complexity increases dramatically. Conceptually, the solution to this design problem is to break the dashboard application into components, each with a more manageable set of features. This is, of course, easier said than done. One approach to application fragmentation in Xcelsius is leveraging the built in EIC (External interface Connection) and standard html/div functionality.
In the example below, two Xcelsius swf files are layered on top of each other. A label input selector is used to pass the page number to an eic connection and the combo box is used to pass both filtered results to the chart, as well as pass the selected company to the eic connection. Java script is used to toggle the z-index of the div in which each swf object is enclosed based on the selected page number.
You can find the XLF file (along with the swf, html and js file) here.

(Note: The example below is embedded in an iFrame and may not work in some browsers that do not support iFrames. If it does not work properly in your browser, you can get to it directly here)

Posted in Xcelsius | Tagged , , , | 3 Comments

SAP Dashboards Thanksgiving trivia game

Inspired by thanksgiving and a family trip to Plimouth Plantation, i created this simple trivia game in Sap Dashboards. It’s just another demonstration of the versatility of the tool, and also kind of fun.. Enjoy the XLF here.
(*Trivia questions have source: http://www.catalogs.com/info/party-planning/thanksgiving-trivia.html)


Posted in Xcelsius | Tagged , | Comments Off on SAP Dashboards Thanksgiving trivia game

Xcelsius data randomizer

One of SAP Dashboards strongest capabilities is in producing quick prototypes. Leveraging Excel rand() function it’s easy to produce random data for your prototype or proof of concept dashboard. Using variations of rand() you can produce random fake data, and leveraging Xcelsius input components you can randomize your data in runtime as illustrated below. The xlf file for this example is available here.


Posted in Xcelsius | Tagged | Comments Off on Xcelsius data randomizer

Using webi ForEach function to solve complex aggregation problems

When you create variables in web intelligence, they must be assigned a qualification. This qualification assigns a “strong” type of either a measure, or a dimension (or a detail) kind of object to your variable. This strong tying has a profound impact on how webi handles aggregation of values in the variable you create, and can be the cause of many headaches for report developers trying to handle complex reporting requirements. The following example uses the e-Fashion universe for illustration purposes:
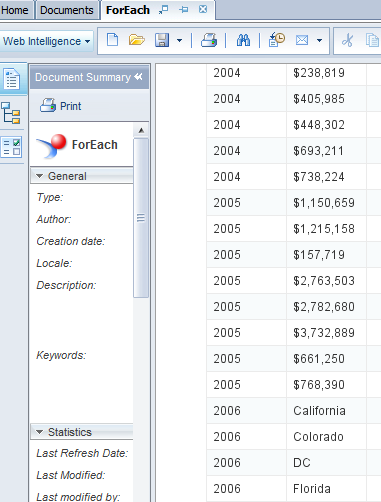
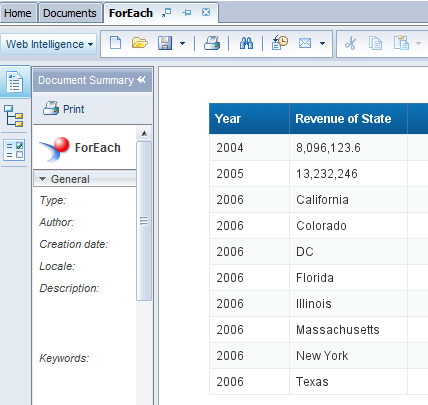
Imagine you need to produce a report that contains a reporting year in column one. Column 2 should display the revenue for the year in prior year, and a revenue state for the current year, and the revenue by state in the third column, for the current year only. Seems fairly simple, right. You can create a fairly simple variable in webi to satisfy the condition for column 2: If([Year]=”2006″;[State];[Sales revenue]) (If the year is 2006, the current year, display the State, else, display the revenue). Your variable will have to have a qualification, and will default to a dimension most likely. When you place your variable in the report, you will see a result far from what you were looking for:

What is happening is that webi is treating the variable value as a dimension and is not aggregating it across the states for the prior years. So even though the states are not displayed, we still get multiple rows for the years, as if the states were included in the calculation context.
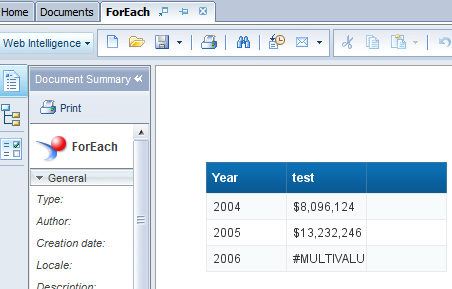
Try to change the variable qualification to a measure, and you get the flip side of the problem: now you get the infamous #MULTIVALUE error because webi is treating the list of States like a measure and is unable to aggregate multiple States per Year.

What can you do? Using the ForEach webi function, you can enforce the proper calculation context for each part of your variable and “loosen” the tight typing of your variable due to its qualification:
If([Year]=”2006″;[State];[Sales revenue] ForEach ([Year]))
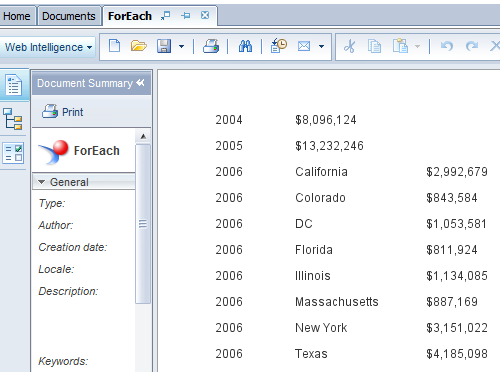
Make sure you set the variable qualification to a dimension, and now webi will be able to properly calculate the proper aggregation for each year, as expected.

Add a similar formula as your third column variable (If([Year]=”2006″;[Sales revenue] ForEach([State]);””)), apply some formatting (with NumberFormat()), and there you go, requirement met.

Posted in Web Intelligence | Tagged | 52 Comments