Google visualization donut chart

While working on an iPad compatible version for our healthcare enrollment dashboard, i wrote about utilizing google visualization API charts. One of the chart types we utilized in Xcelsius was a donut chart, and while the google visualization library doesn’t have a donus chart per se, i was able to produce one using some layering techniques. This nice interactive donut chart will render just as well on any browser or device. You can find the source code below. Enjoy.


donut.html src:
<html>
<head>
<script type="text/javascript" src="https://www.google.com/jsapi"></script>
<script type="text/javascript">
google.load("visualization", "1", {packages:["corechart"]});
google.setOnLoadCallback(drawChart);
function drawChart() {
       var data = new google.visualization.DataTable();
       data.addColumn('string', 'Task');
       data.addColumn('number', 'Hours per Day');
       data.addRows([
       ['A',    roundNumber(11*Math.random(),2)],
       ['B',      roundNumber(2*Math.random(),2)],
       ['C',  roundNumber(2*Math.random(),2)],
       ['D', roundNumber(2*Math.random(),2)],
       ['E',    roundNumber(7*Math.random(),2)]
       ]);
var options = {
width: 450, height: 300,
colors:['#ECD078','#D95B43','#C02942','#542437','#53777A'],
legend: {position: 'none'},
   animation:{
       duration: 800,
       easing: 'in'
     }
};
var chart = new google.visualization.PieChart(document.getElementById('chart_div'));
chart.draw(data, options);
}
function roundNumber(num, dec) {
 var result = Math.round(num*Math.pow(10,dec))/Math.pow(10,dec);
 return result;
}
</script>
</head>
<body>
<div id="link_div" style="z-index: 3; position: absolute; left: 180px; top: 30px;">
<a href="javascript:drawChart()">Change Data</a>
</div>
<div id="chart_div" style="z-index: 1; position: absolute; left: 0px; top: 20px;"></div>
<div id="circle_div" style="z-index: 2; position: absolute; left: 180px; top: 127px;">
<img src="circle.png"></div>
</body>
</html>
Posted in Data visualization | Tagged , , , | 17 Comments

Xcelsius Flight Seat Order models visualized

On a recent international flight I had a chance to ponder how much the order of seating passengers really impact the amount of time it takes to get all the passengers seated. On one flight, the crew called passengers to board the plane by row number. Starting from the back of the plane and working their way to the front, row by row, passengers were called to board. On another flight, general boarding commenced immediately. Between passengers who do ignore the ground crew directions regarding which rows are boarding, and the many other variables that impact seating airplane passengers, does it really matter that much? While I do not have enough data to make a call either way, I was able to come up with a visualization exercise for this problem that combines several Xcelsius modeling techniques, such as combining the player selector with a history component to get a staggered dynamic visibility effect (the rows appear in order, and stay painted). Enjoy the XLF here.

Randomize seating order

Posted in Xcelsius | Tagged , | Comments Off on Xcelsius Flight Seat Order models visualized

Live poll using Xcelsius

Which phone do you like best? iPhone? Android? Blackberry?

The example below integrates several techniques to come up with an interesting concept: an Xcelsius based live poll. This sample integrates Xcelsius with ajax to store your vote in the database table, xml feed to report the results of the current poll, and eic (external interface connection) to fire the xml connection when after firing the vote ajax function. By the way, i voted for the iPhone… (This example was tested on firefox)

Posted in Uncategorized | Tagged , , , , | 21 Comments

Dynamically resizing images in Xcelsius

It is sometime useful o be able to dynamically change an image size in Xcelsius, based on user inputs for example, or on a data variable that changes live, or as a result of user input. Xcelsius components, except for charts, are typically fixed in size and position, and there is no way to move or resize components on the fly. However, using the following technique, you can dynamically change the size of images in your Xcelsius swf to fit your data visualization needs.
To accomplish this effect, i used the slideshow component, and bind it to a url that is constructed dynamically based on the user input in the width or height sliders. The url is pointing to a php file that streams the image and changes it’s size based on the width and height variables supplied over the url (using PHP GD library). You can find all the source files (.php, .xlf) here. Enjoy!


Posted in Xcelsius | Tagged | Comments Off on Dynamically resizing images in Xcelsius

Xcelsius bubbles

Not much to say about this one, i just really like bubbles… Using bubble charts in Xcelsius can be very appealing.


Posted in Xcelsius | 2 Comments

Bookmark Xcelsius Dashboard

The other day, my colleague Josh Tapley (http://data-ink.com) and I had a conversation about being able to “bookmark” an Xcelsius dashboard. Basically, the idea would be to “save” the user context on the dashboard and be able to return to the same context. Well, below is an example of such an implementation. The dashboard is embedded in a php page. The Bookmark button on the dashboard is a text label with html code to trigger a javascript ajax function that takes the user context in the dashboard selectors, assigns them an id, and saves them in a database table. When the id is passed back to the embedding page, the proper values are retrieved and are used to initialize the dashboard. Enjoy!

Posted in Xcelsius | Tagged , | 4 Comments

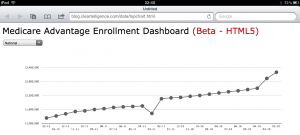
Medicare dashboard – for your iPad

The pursuit of BI Happiness involves being able to view your own dashboards on your iPad or iPhone. To that end, i began converting our medicare dashboard into a pure html5 version. It works much the same way, using the dame data architecture (leveraging our mySql datawarehouse with php generated xml feeds to get data to the dashboard). This pure html/js version uses google visualization API with ajax calls to retrieve the xml data on combo box change. The xml feeds get converted to JSON format that can then be fed into a google data visualization DataTable and displayed in the chart. I also implemented transition animation effects, so as you change your state selection, the chart will “swoosh” nicely, just like in flash… Enjoy it on your iPad! And check in soon, more features coming…

Posted in BI At Large | Tagged , | Comments Off on Medicare dashboard – for your iPad

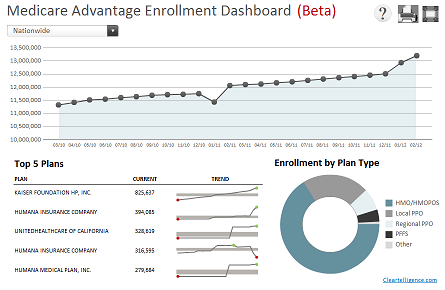
Medicare Advantage Enrollment Dashboard

About a month ago, my colleague, Josh Tapley (http://data-ink.com/) and I set out to build an Xcelsius based BI application. Our goals were to demonstrate the capabilities of the technology, when combined with some fundamental data warehousing and BI techniques and great design principals.

We started our quest by looking for a large, publically available, dataset that will be interesting to analyze. We wanted to use a data set that can produce valuable insights by applying analytics and data visualization techniques to it. Josh suggested we use the government center for Medicare and Medicaid services which publishes monthly national Medicare enrollment numbers each month. The data is published as text and excel files and is proliferated across the site. It is a classical example of large amounts of data, published in raw format for users to wrestle with and with no information or insight in sight.

We proceeded to create a data repository (data warehouse of sorts), essentially coming up with a process for collecting the multitude of data files across the various sources it is published in, and loading the data into a database, using ETL techniques. The most granular fact table in our database of Medicare records contain 588846 records as of Feb 2012, it grows at a rate of approx 30-50K records a month. Not bad for a publically available data set.

We applied an aggregate strategy to our database to assure the queries we perform on it to support our application are adequately fast and users experience minimal delays as they navigate this rich data set.

With all the data on hand, we set out to design our application. We used simple, clean and intuitive design principals to highlight the analytics, and allow users to easily understand enrollment trends across several key factors. We wanted to tell a story, paint a picture, and not require users to struggle and stumble through complex interfaces and data layouts to get a gleam of information.

With our design at hand, we created a series of xml feeds that query the database on the fly and return result sets that meet our application layout needs.

The result is what we consider to be both a useful and informative analytical tools for anyone in the healthcare industry and beyond, as well as a good showcase of BI Happiness.. Please be sure to checkout our Medicare Advantage Enrollment Dashboard.

Enjoy!

Posted in BI At Large, Data Warehousing, Xcelsius | Tagged , , , | 15 Comments

Integrate BusinessObjects BI Services 4.0 with PHP

BusinessObjects 4.0 web services provide a access to BI content for any application that can invoke and consume web services. Xcelsius is probably the best known example of this notion in the BO applications space. Xcelsius (SAP Dashboards) leverages the BI Platform web services for any sort of integration/data connectivity, from authentication/authorization to getting data from webi report parts thorugh BI Services, QaaWS or Live Office.
While SAP provides very good documentation for the web writing web services applications using its java and .net APIs there’s really not a lot out there if you wnat to use something else to consume these web services. For example, if you are running a php application and are looking to integrate some BO data in your web site, there’s really no information to get you going. So, what can you do? Well, here’s how I went about figuring out PHP integration with BO using BI Services:
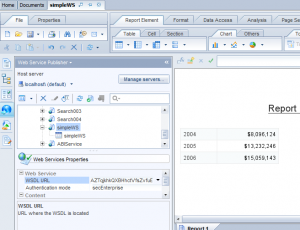
First, i created a simple webi report, using eFashion universe, and published my report block as a BI Service.

Next, i created a simple java application, using the web services api, to call this web services. The java web services sdk documentation is very explicit about simple use cases, like calling a web service, or you can leverage eclipse (which is what i did…) to build your web service client, using the swdl of the BI service created.

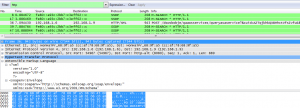
The next step is the secret sauce really… using a network sniffer (i used wireshark), i captured the http traffic while executing my java client and VIOLA, i had the soap envelope xml for calling my BI service!

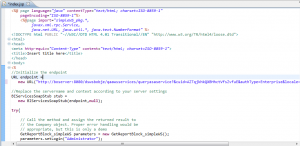
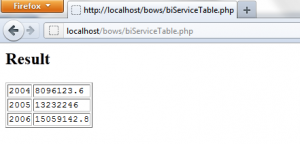
With this in hand, i used nusoap, a commonplace soap api tool for php and was able to reconstruct the soap request in the nusoap client, call my bi service from the BO server, and parse the results into a simple html table. You can find the php file for download here. Enjoy.

Posted in BusinessObjects 4.0, Web Intelligence | Tagged , , | 4 Comments

Google maps in webi 4.0 mashup

I recently received several questions about a google maps in webi mashup post i published some time ago. So, i decided to redo the example, using SAP Business Intelligence Platform 4.0 and the latest version of webi.

 In the original post, i used server side code (.jsp file) to pass info from the webi report to the google maps. This time, i used client side code (javascript), which is better suited for this application and provides better flexibility.
The crux of this approach is as follow:
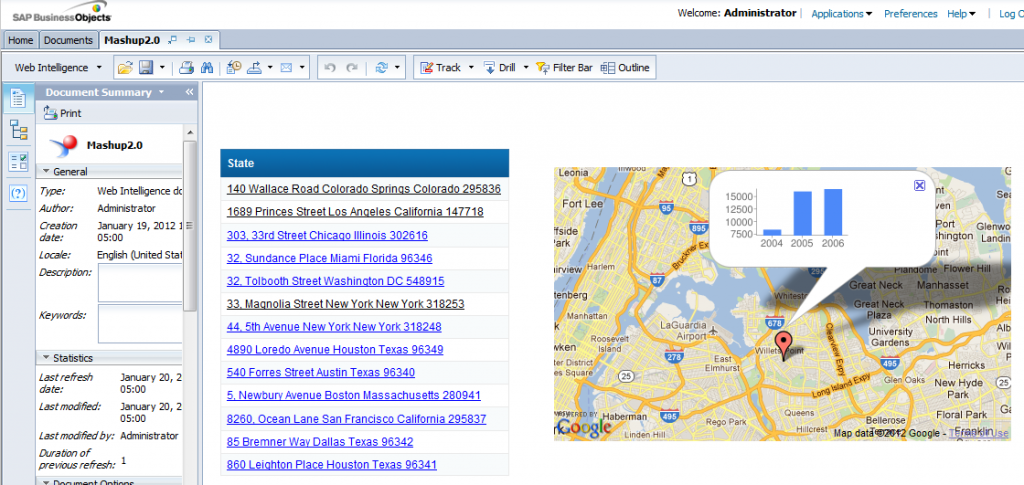
A webi report based on the e-Fashion sample universe was created, the report has store address info, and yearly sales numbers.
The webi report contains two blocks. The left block has hyperlinks with store addresses, and the right block contains the map. When you click a store on the left, the map updates with the address of that store and the map info window displays the store yearly revenues as a bar chart.
 The map is created in webi using a small html code snippet that embeds the html file that contains the actual map parsing and creation code in an iframe inside a div.
The left block contains a formula that translates the store addresses and revenues to html  hyperlink that targets the iframe, passing it different address and sales data so it reloads with the new store data as you click the hyperlinks.
That’s it in short. You can find the report .wid file, and the embedded html file in a zip here. Enjoy!

Posted in BusinessObjects 4.0, Web Intelligence | Tagged , | 47 Comments