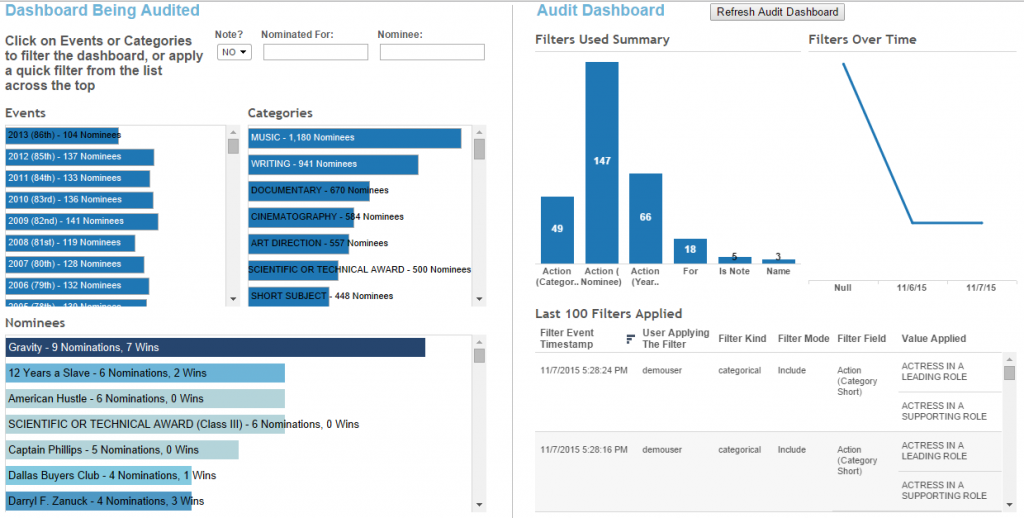
While Tableau Server provides good auditing capabilities in terms of logins and dashboard views, in some cases, you need very detailed and granular auditing of certain dashboards. Like other websites, you may need to understand exactly which features of a dashboard are used by understanding how users interact with a dashboard. Which filters they are using and how, what navigation paths are taken, and what selections are being made by different users. If you do need to get to this level of auditing detail, you can use the Tableau javascript API which provides programmatic means to capture all the interactions on a viz. As a proof of concept, I went ahead and created this demonstration. The proof of concepts consists of two dashboards, laid out side by side on a web page. The left dashboard is being audited. It is loaded with my Oscars data as an extract, and contains several filters. You are encouraged to use the filters and click around this dashboard. The dashboard on the right uses a live connection to the audit database and can be refreshed to view live data by clicking the refresh button on top. As you click on filters on the left, you will see them populated on the right…
To accomplish this, I needed to address three areas of development: database backend audit table, server side service to process the audit event and save them in the table, and a frontend javascript component to utilize the Tableau JS API, capture user clicks and pass thenm to the backend service.
I began with the database layer and created a simple auditing schema with some information I wanted to track about it in a database table. The attributes I am tracking are the audited dashboard workbook file name and url, the dashboard name being clicked on, the username of the tableau user evoking the action, the filter field being applied, the field type, whether the filter is being used in include or exclude mode and the filter values being applied.

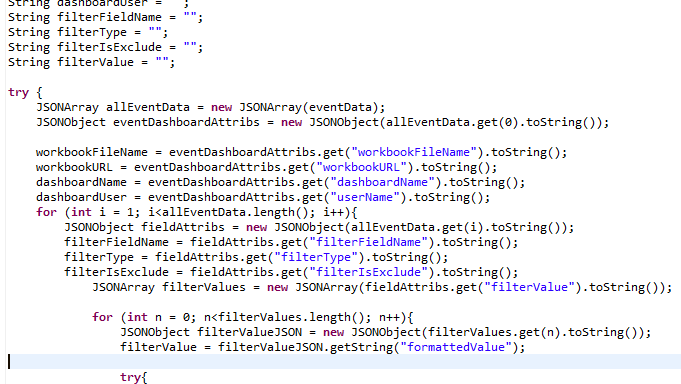
With a database table in place, I went on to write a RESTful web service that I could connect to from a webpage via javascript and pass info to be saved in the table.
Due to the asynchronous nature of the filtering and auditing sequences, I ended up putting some more login in the service class to be able to parse a JSON string that may contain multiple filter events. Since a single filter event may contains several values being applied, to save on the “chatter” between the dashboard and the server. This is despite the fact that the auditing is happening in the background asynchronously and does not impact the dashboard performance.
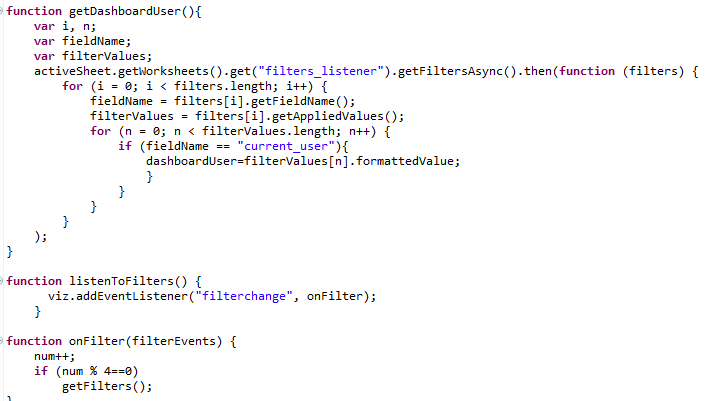
The third leg of this audit stool was the javascript needed to collect the user events and pass them to the service. The Tableau JS API provides methods to get filters and selections, as well as events that can be listened to for both operations. This was the hook needed to develop the audit capability. To handle filters, a hidden sheet is included in the dashboard and is “probed” for the filters being applied to it from the dashboard on each filter or select event. Selection events are also captured. In developing this script, I did not use any framework such as AngularJS, or even jQuery, and kept to the basics.
Finally, I created another dashboard connected live to the audit database, to explore the audit events being captured on the first dashboard, and created a webpage to lay them out side by side. One final issue to grapple with was handling the trusted authentication SSO through the API, and was that was sorted out, the demo was complete. Enjoy!


Nice solution. Apart from the partial screenshots, I did not see the sample code anywhere. Can you provide?
Thanks!
Don Collins
Thank you Don, the client side code was all available in the working example, which was blown up.. I will re-instate soon and re-publish so the code will be available again.. Thanks – Ron
I would love to see the source aswell. Is it already available?
Many thanks,
Mika