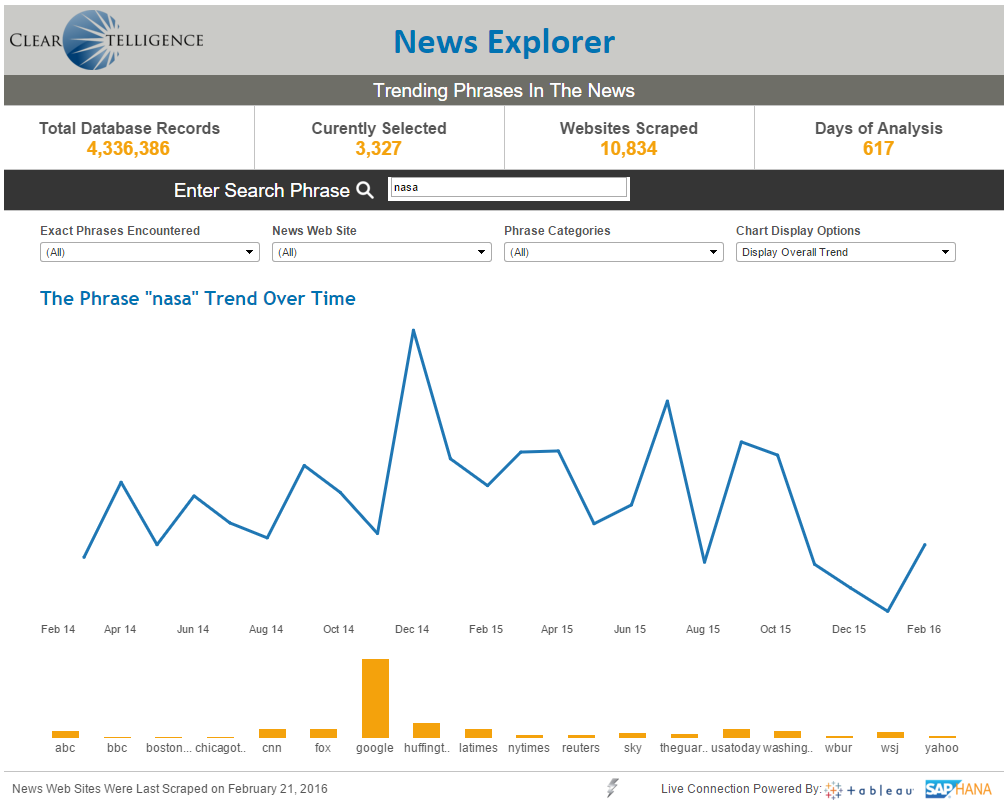
Two years ago I wrote about setting up a process to scrape leading news websites home pages and storing them in HANA for text analysis. I hypothesized about the various analysis one could derive from parsing multiple news websites over time and looking at words and categories patterns over time. Well, after two years of accumulating data, we now have a significant enough dataset to start mining and analyzing for trends. The first attempt I made at building an analytical tool on top of this dataset is a word trend explorer. This is meant to provide users with the a ability to search for any words or terms in the news, review how often the term has been used across time, observe the trend by time only, category or word and source as well, and dive into the specific details by providing the word/phrase content/context for reach search. There are other capabilities that were critical to any such tool as well: performance – it has to be fast, useful – it has to be functional and interesting, usable – it has to be fairly intuitive to use and beautiful – it has to look good and meet modern design standards.
I also wanted to use some tools and technologies that are widely adopted and can be related to by many organizations and users, who can leverage this example as a demonstration of capabilities for their own projects.
So, this dashboard was built using Tableau. It is hosted on Cleartelligence tableau server and is exposed via a proxy to the outside world. We are using trusted authentication to bypass the Tableau login screen and allow users to access the specific content straight from the World Wide Web.
To provide full scope of analysis to the entire dataset, we are leveraging a live connection in this dashboard. It would have been impossible to use an extract with so much data. As you use the tool you will discover that the performance of the live connection, which relies on an SAP HANA in-memory database, is as fast as an extract (if not faster..).
While developing the dashboard several UI techniques were used to refine the look & feel of the dashboard, from leveraging images, and applying various formats to more refined techniques.
Finally, displaying the word mentions in the dashboard required working with BLOB objects in the database (the news data is stored in BLOBs that are parsed in HANA to words with sentence and offsets indices). This required implementing some out-of-the-box functionality in the form of a java program to obtain the relevant blob data from HANA, extract the relevant sentences and display it within the Tableau dashboard using a URL action that is triggered when you click on a month point in the trend bar.
Furthermore, to support a modern web site experience, we implemented a modal window popup from the Tableau dashboard that is being triggered by the URL action.
I hope you enjoy this tool and use it to learn about interesting news related trends. I look forward to adding additional functionalities to this tool, and welcome suggestions and other feedback!


Thank you for your help
I am afraid I could not access your dashboard to confirm what you have: “we implemented a modal window popup from the Tableau dashboard that is being triggered by the URL action.”
Would you be able to share the method by which this was achieved. I am very interested in the function, as I cannot see how to do this out-of-the-box with Tableau.
Any help greatly appreciated
There are many ways to accomplish this.. the approach implemented and described in this article was to embed the dashboard in a web page, and leverage a url action to call a java script in the parent frame. To do that, the javascript “protocol” must be whitelisted on the Tableau server. Another approach (perhaps simpler) would be to simply leverage Tableau JS API and use an event listener on click that would trigger the modal popup and pass the relevant values from the click action.. You can find sample code and examples of similar concepts in other posts here..