Crystal Reports versatility

Crystal Reports is perhaps the most versatile reporting application in the world. It’s popularity predates most modern business intelligence tools (and vendors..) and its users base is simply astounding. The functionality built into Crystal Reports can certainly be overwhelming for most users, which is probably why simpler, more user friendly tools have surpassed Crystal in popularity these days. However, don’t rush to write it off in any way… There are still many functionalities and capabilities built into Crystal Reports that cannot be matched with any other reporting tool (SAP’s or otherwise).
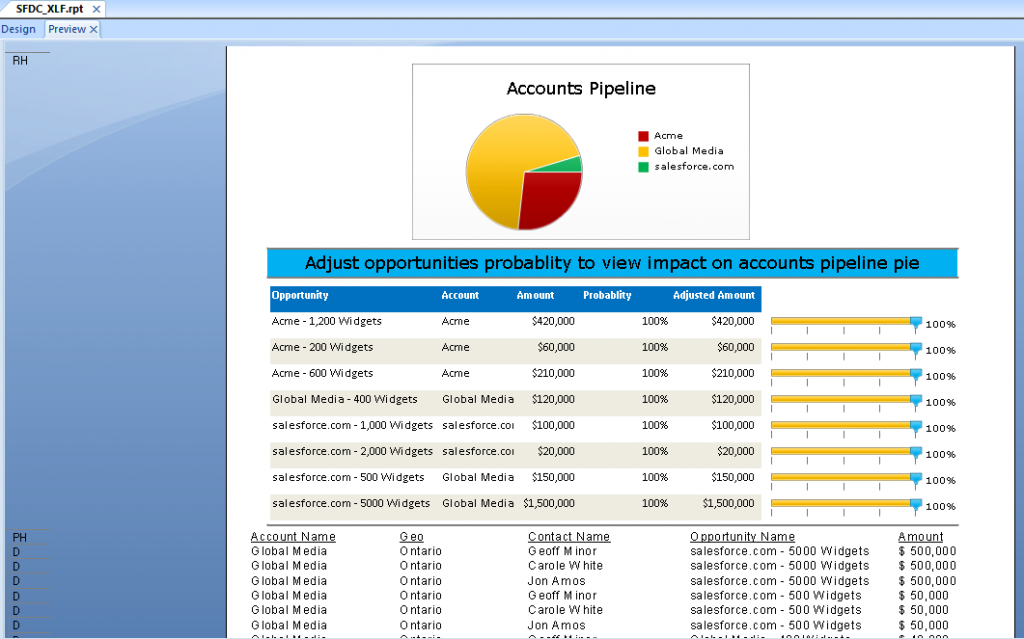
Just as an example, i created a quick crystal report that connects directly to salesforce.com (yes, among crystal tons of connection methods, there is also a direct connector to SFDC), passes the data to an embedded Xcelsius generated swf and display a simple grid underneath it. This can be easily exported to HTML or PDF formats (or scheduled for distribution for that matter). Here are some sample files, used to build this example (.xlf, .rpt, export .html and .pdf, all zipped up)

One of the reasons many organizations are not leveraging crystal these days is that IT managers prefer to standardize on the toolsets they will support. This makes sense from a team and core competency building perspectives, and when comparing webi to Crystal from that angle, webi makes a lot of sense. It appeals to a much broader audience in the organization and can deliver on most reporting needs. However, more sophisticated requirements are often much better suited to be addressed with Crystal, so it may make sense to keep around some CR expertise that can quickly address those urgent seemingly impossible requirements…

Posted in Crystal Reports, Xcelsius | Tagged , , | 4 Comments

Search Filter in Xcelsius

Xcelsius popularity as a platform for building BI applications increases, and the demand for streamlined functionality, such as search, is growing as well. Unfortunately, there is still no “search” component or functionality built into Xcelsius yet. However, using your excel model and leveraging filtered rows functionality  you can build search functionality into your Xcelsius driven BI application or dashboard. In a prior post i wrote about creating a google like search by leveraging database connections to retrieve new data as users search large result sets. In this example, i created a search filter that DOES NOT require a data refresh and filters the results within the data stored in the xlf/swf. This is suitable for smaller datasets, where the record count is still large enough to merit a search, but not so large that it requires a round trip to the database. In the example below, type a search term from the state, city, store name or name of manager column and hot enter ot click search to see the grid filter appropriately.

You can find the XLF for download here. In a nut shell, the way this works is as follow:
the input text box is linked to a cell in the model. A formula is used to set the search term to lower case. Then, the FIND function is used to check if the search term is contained in each cell of the dataset. If it does, a label is set to a value, otherwise is set to blank. These labels are finally used to filter the rows to the ones that matched the user search term. Enjoy.

Posted in Xcelsius | Tagged , , | 14 Comments

Create your own webi report part viewer using HTML DIVs

Very often i run into the need to embed a webi report part, such as a table block, in a separate application, outside of InfoView. There are many ways to accomplish this, from leveraging the webi REBean SDK to using the openDocument api. The openDocument api in particular is very handy, since it is so easy and simple to use, and requires no coding. However, in many cases, all that is needed is the report block to be displayed on a screen, rather than the entire webi interface. Using some carefullt placed HTML placed DIVs, you can accomplish that.
While the openDocument api does have the ability to display specific report parts, using the sReportPart argument, it provides only limited functionality. It is officially only supported for Crystal (although it does work with webi as well), but fails to include some of the important controls that come with webi such as pagination, filters, saving and zooming. Leveraging html DIVs, you can “hide” the elements of the webi page that you are not interested in showing, and create a webi presentation, with no coding, that can be included in an external web application.


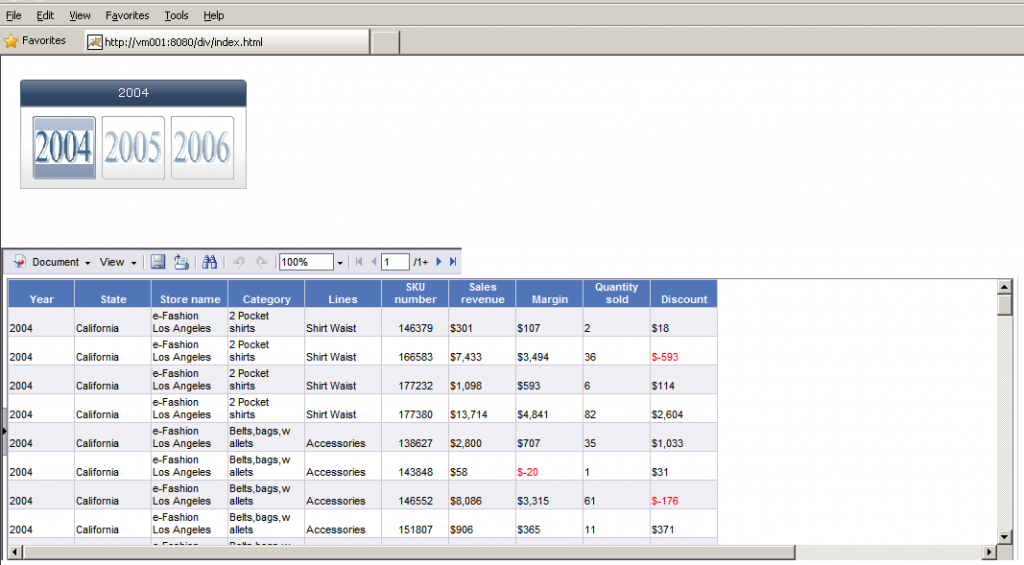
In the example captured above, you can see an Xcelsius selector with a webi table underneath. The selector uses an EIC to pass a parameter value to the webi report part using the openDocument api and a JS function reloads the webi iFrame when the EIC value changes. DIVs are used to cover up all the webi “extra” unwanted elements, and expose selected menu options as well as the table block.
You can find here the sample files, zipped (xlf, swf, html and .wid, based on e-Fashion).

Posted in Web Intelligence | Tagged , , , | 2 Comments

SAP BusinessObjects Dashboards 4.0 Cookbook review

I was recently asked by Packt Publishing to review Xavier Hacking and David Lai “SAP BusinessObjects Dashboards 4.0 Cookbook”. I just finished reading the book, and wanted to share some thoughts.
This is a tremendous resource for Xcelsius developers. The format of a “recipe book” is a wonderful idea, and is perfect for folks who are looking to become effective with Xcelsius very quickly, looking for a point solution to an immediate problem, or just needing some creative inspiration when working on their dashboard.
You can skim through the list of recipes and pick the ones you are interested in “cooking up”. The electronic format makes is very simple to find relevant information, rather than flipping through pages, i could use the find functionality to quickly look for a specific topic.
The recipes cover a wide array of topics, starting with topics relevant to beginners who are looking to understand fundamental best practices, to advanced users who are looking for new creative ways to extend their repertoire of Xcelsius tricks. The book covers pretty much the entire spectrum of dashboard development from components, to the model, excel, data connectivity, publishing and even third party tools. I thoroughly enjoyed reading it, and am very impressed by the breadth of coverage. This is a wonderful reference applicable to any Xcelsius developer.

The book is available in from many places on the web, the publisher’s web apge for it is at: http://www.packtpub.com/sap-businessobjects-dashboards-4-0-cookbook/book

Posted in Xcelsius | Tagged | 1 Comment

Use Crystal Reports Data Consumer and subreports to burst complex Xcelsius dashboards

More often than not Xcelsius dashboard developers are being asked to come up with ways to burst the dashboard. It makes perfect sense. Dashboards are typically high level executive summaries, designed for management consumption, and managers typically prefer to have information pushed to them then go pulling  for it. The more “executive” the dashboard is, the stronger the requirement to be able to “email” the dashboard is. The problem is that at the moment, with BOE version 3.x, there is no native way to schedule and email Xcelsius dashboards. They are designed to be consumed online. There are third party tools that can handle this (like InfoSol), but if you are looking to stay within the constraints of the “out-of-the-box” BOE platform, this can be quite a challenge.
One way to work around this problem is to leverage Crystal Reports as the “container” for the dashboard. You can use Crystal for two purposes:
1. Crystal reports that embed Xcelsius .swf files CAN be scheduled and bursted, as PDF for example, from InfoView
2. You can connect Xcelsius to live data using the Crystal Reports Data Consumer connection to get data from the universe populated in real time into the dashboard
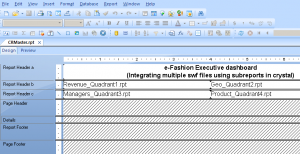
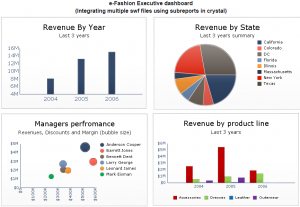
The main limitation on the Crystal Reports Data Consumer connection is that you can only have one of those in any .xlf file. Well, luckily, Crystal provides a good solution to that problem in the way of subreports. You can create multiple .swf files and “connect” them in a single master Crystal reports as individual subreports.


There are additional limitations to this approach, and highly complex dashboard will not lend themselves to this method, but for moderately complex dashboards that require combining multiple data sets that span different granularities, this can be a simple and clean solution.
You can find the sample .xlf, .swf and .rpt files here. The samples use the e-Fashion universe for live data

Posted in Crystal Reports, Xcelsius | Tagged , , | 4 Comments

Generate QR Codes in Webi or Crystal Reports

QR Codes are quickly becoming a standard method of communication. QR Codes are two dimensional bar codes that allow QR readers to translate the encoded data and take actions on it. Any camera equipped smart phone today can easily read a QR code. For example, QR Codes are used to automatically add contacts from business to the phone. You can open websites and pass all sorts of data using QR codes. They are super popular in Japan and Asia and are now getting traction in the US, really really fast.
One thing QR codes can help with in terms of BI is making reports actionable. QR Codes can be used to allow information consumers to go to a certain website page, or web application, submitting information they read on the report, scan a code and send an email notification, or as in my example, provide a quick way to add contact information into the phone contacts list.
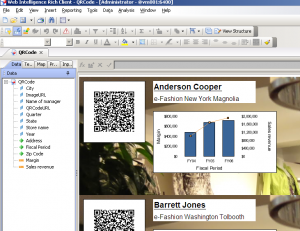
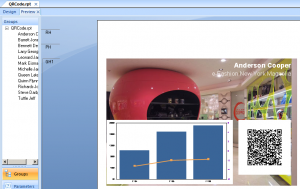
Using the sample eFashion universe, I created a simple report that contains the stores, store managers, and some sales and margin stats. Then, i created a vcard encoded string containing the  store manager info, address etc. Finally, i used the vcard string as the input into the google charts api to generate a QR code image, and used that image in a webi report, as well as a crystal report.
You can download sample crystal report .rpt file or web intelligence .wid file that contain these examples.


Posted in Web Intelligence | Tagged , | 4 Comments

Xcelsius Count Down Clock

Not much to say about this one, just decided to do a count down clock in xcelsius. You can download the XLF HERE and modify the end date and text as you please…

Posted in Xcelsius | Tagged , , | 2 Comments

Integrate Linkedin search in webi reports

In an older post i wrote about integrating linkedin searches with Xcelsius dashboards. The example i created used an EIC (external interface connection) to pass a value to a search section at the bottom of an html page, whereas the top part of the page was made out of an Xcelsius dashboard.

Well, web intelligence also has two html viewers that can be used to view and edit reports online using a web browser. This means they can be leveraged to add additional web pages content and create nice mash ups (see other post here).

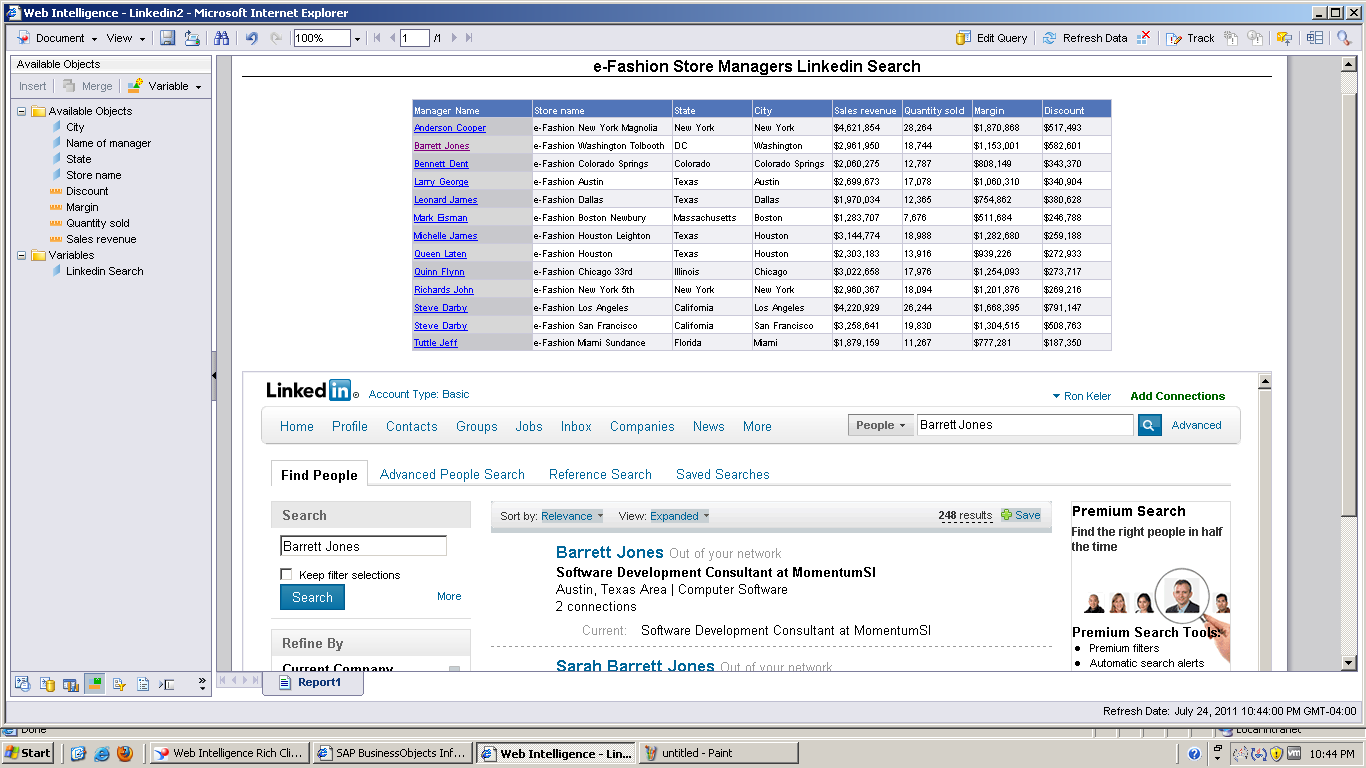
In this example, i created a list of e-Fashion store managers from the e-Fashion universe (i just added some made up last names to the manager column in  the e-Fashion mdb file. The original has first names only..). The list is used in a webi block at the top section of the report. In the bottom section of the report i added another block. I used relative positioning to line them up nicely.

I embedded the store manager name from the webi query in a hyperlink that references a small js function to open the contents of the link in a named frame see the html code below). I made the cell formatted as read as html, so webi knows to render the formula correctly in the html viewers. The bottom part of the report contains the block that has the html snippet for the named frame (i’m using an iframe). Once again, the cell is formatted as html. The result is quite interesting and i’m sure there can be many other implications and uses similar to this.

The limitation of this approach is printing. Webi does not have native browser printing capability, and requires converting the report to pdf in order to print. In the conversion process, andy cells formatted to be read as html revert back to text rendering and will display the actual cell html content rather then the browser rendering. I am working on a solution to this issue, and hope to have something posted soon on this issue…

Store manager name hyperlink: =”<A HREF=”#” onclick=”ronkeler.location.href=’http://www.linkedin.com/search/fpsearch?pageKey=fps_results&type=people&pplSearchOrigin=GLHD&keywords=”+[Name of manager]+”‘”;return false”>”+[Name of manager]+”</A>”

Bottom block (iframe with linkedin website): <iframe src=”main_page.html” name=”ronkeler” width=”1030″ height=”1000″></iframe>

Posted in Web Intelligence | Tagged , , , | 2 Comments

BIHAPPY Blog moved

After almost three days of down time from my prior service provider, blog.com, i moved my blog to godaddy hosting service. I don’t expect to have this kind of down time ever again.

Posted in Uncategorized | Comments Off on BIHAPPY Blog moved

If you build it – people will come?

In the 1989 phenomenal hit Field Of Dreams, Kevin Costner’s character, Ray Kinsella, hears a voice instructing him to build a baseball field. Later on in the movie, James Earl Jones, who plays Terence Mann, tells Ray Kinsella “If you build it, people will come”. What a great tag line. All you need to do is build it, and people will come.

Well, for Ray Kinsella say “all you need to do”, means driving across half the country, on a sometimes very scary journey, almost losing his house and all his lifetime savings, and not to mention almost having his daughter die. So, building it is not easy. But at least Ray is being reassured that once he is done, people will come.

Oh, how i wish this was the case in BI projects.

The build part can be similar. Erecting an enterprise data warehouse can be a very difficult and lengthy task. And any BI project, small or large, always presents challenges. Some are common to any project work, like scope creep or expectations management, but some are unique to the domain and have to do with the subtle dance BI professional have to learn between technology and business.

But the most difficult challenge, comes after the project work is supposedly over, and the new report, application, dashboard or system are in place. Will people come?

Unlike a mission critical operational system, a BI system is typically not integrated into the operational processes of the business. Its purpose is to analyze and examine these process in order to provide insight that can improve them. So, in its essence it’s a change driving force, and a lot of people in the organization don’t like change.

If there is no clear and decisive adoption plan for the BI solution that articulates very clearly how and why the system must be used to complete the operational business procedures, it’s very likely that, well, people won’t come, and while the quality of the product produced can be undeniable, without usage, it is worthless.

So, be sure to keep this in mind as you set your sights on your next BI project and ask yourself how will you assure that once your data modeling, etl, metadata management, reporting and dashboarding goals are all met, will you assure sufficient adoption by the business users community to guarantee your return on investment. The same way all the other project activities are planned, managed and risk assessed, the training, business process adaptation, perks and contexts around the new tool usage, must all be planned in advance as well, and be ready to execute once the development work is complete, and the BI product is rolled out.

Posted in BI At Large | Tagged , | 3 Comments