Custom tabbed navigation in tableau


This example illustrates how a combination of images used as tableau shapes, with some careful positioning and action filters, can be used to create custom navigation effects that will feel natural and intuitive to most users. Here is a description of the process used to produce this tableau dashboard:
First, using power point, 2 images were created, a selected tab and an unselected tab.

01_tabs

These images were added to tableau shapes repository.

02_image_repo

Then, in tableau, these images were used to create two sheets for each tab screen, a selected tab state and an unselected tab state.

03_home_selected 04_home_unselected
Then, 4 dashboards were created with the worksheets containing the images carefully positioned on each dashboard

05_tabs
Finally, action filters were created on each page to navigate to the appropriate page on selection of each navigational tab sheet as needed

06_actions
The dashboard was published to the server and.. Voila! The custom tabs are ready

Posted in Data visualization, Tableau | Tagged , , | 7 Comments

Tableau recalls dashboard using Extract API

tableau recalls dashboard

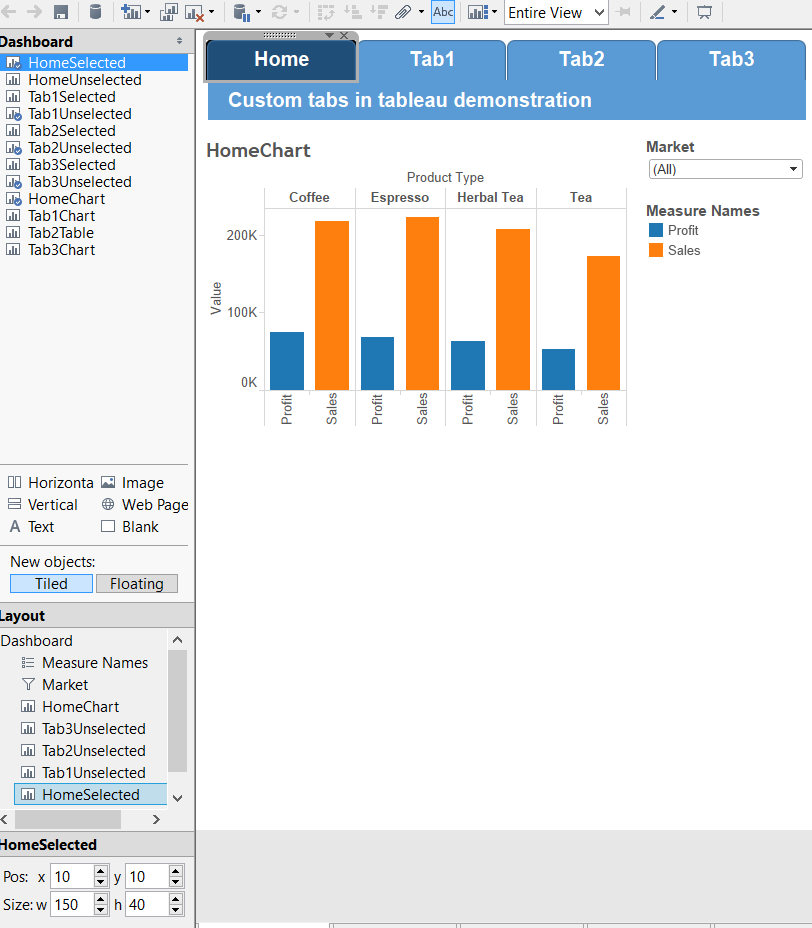
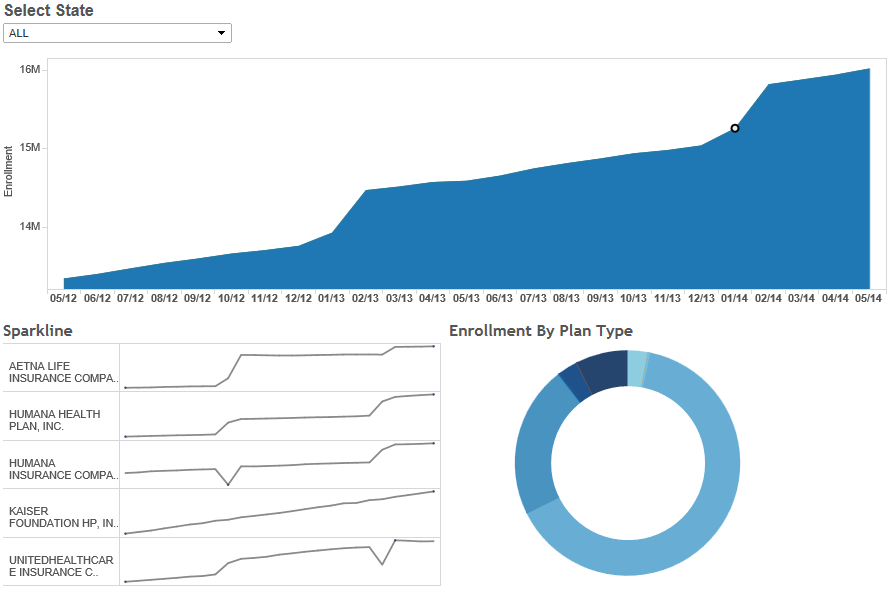
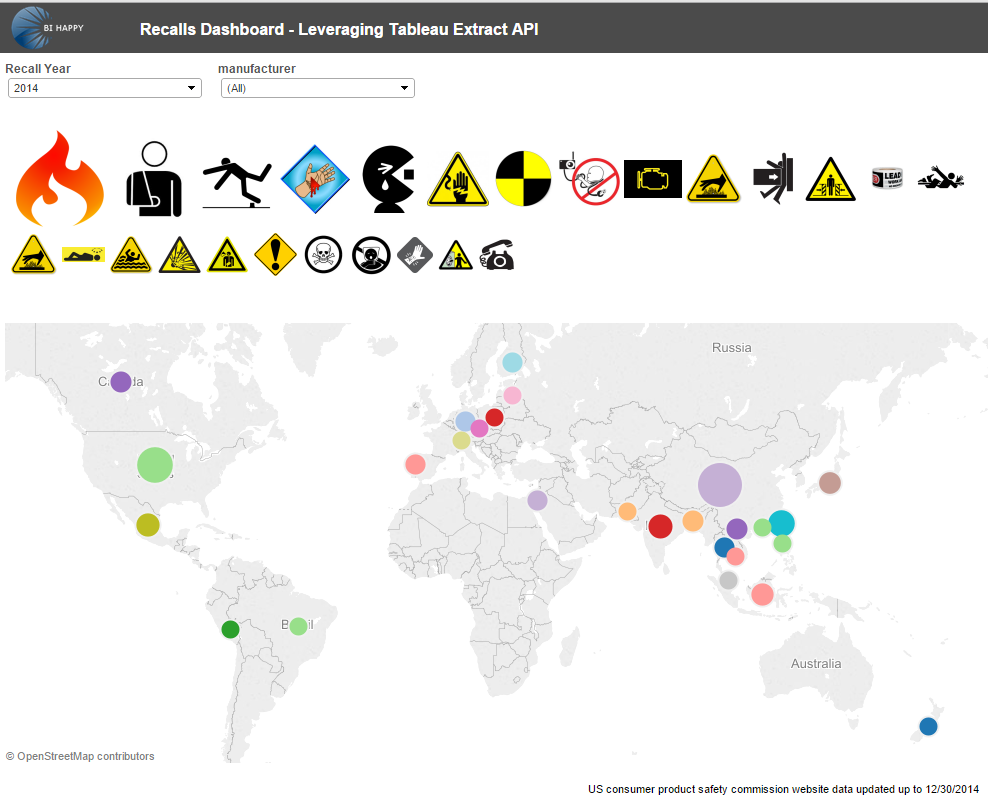
In this recalls dashboard, I used custom shapes/symbols to represent each hazard and reflected the number of recalls through the size of the symbols. I also used the manufacturing country to create a map of the recalls, were the size of each country bubble is representing the number of recalls (guess which country gets the biggest bubble…). I also added a link to a detail page that has each recall info, and a link to the agency recall web page about the recall. And the sweetest thing, I will not need to touch this dashboard ever again, it refreshes the data from the xml each night automagically.. Be sure to click the image above to visit the live dashboard!

A couple of years ago I published an HTML5 recalls dashboard on this blog (http://bihappyblog.com/2012/12/17/recalls-dashboard/). To create this dashboard, I connected to the Consumer Product Safety Commission web site and converted the xml data it provides into JSON format to be consumed by the HTML5 dashboard. Recently, I ran into the Tableau Extract API and I thought it would probably be interesting to create a Tableau version of this dashboard, in which I could leverage the Extract API to convert the XML feed provided by Consumer Product Safety Commission in Tableau extract format (.tde file). Once that technical hurdle is accomplished, Tableau could be used to create really neat visualizations quickly and easy. What’s more, this illustrates the possibility of connecting Tableau to virtually any data source, currently supported by Tableau or not, since the Extract API can be used to create a .tde file from virtually any data that can be connected to programmatically.

First thing is first, I made sure I followed the Extract API instructions for Eclipse (http://onlinehelp.tableausoftware.com/current/pro/online/windows/en-us/extracting_TDE_API.html). Once my environment was setup, and I was able to run the sample MakeOrder app to produce a .tde file, it did not took much adaptation to write my own class to connect to the CPSC website to obtain the recalls in their XML format, iterate through the XML document and convert it to the Table format needed to produce a Tableau Extract file. Below is the source code for that..

package com.cleartelligence.tableau.extract.api.sample;

import java.io.IOException;
import java.io.InputStream;
import java.net.URL;
import java.net.URLConnection;
import java.nio.file.Files;
import java.nio.file.Path;
import java.nio.file.Paths;
import javax.xml.parsers.DocumentBuilder;
import javax.xml.parsers.DocumentBuilderFactory;
import org.w3c.dom.Document;
import org.w3c.dom.NamedNodeMap;
import org.w3c.dom.NodeList;
import com.tableausoftware.TableauException;
import com.tableausoftware.DataExtract.Collation;
import com.tableausoftware.DataExtract.Extract;
import com.tableausoftware.DataExtract.Row;
import com.tableausoftware.DataExtract.Table;
import com.tableausoftware.DataExtract.TableDefinition;
import com.tableausoftware.DataExtract.Type;
public final class MakeRecalls {
     private static TableDefinition makeTableDefinition() throws TableauException {
        TableDefinition tableDef = new TableDefinition();
        tableDef.setDefaultCollation(Collation.EN_US);
        //Create a table definition based on the recall data
        tableDef.addColumn("UPC",       Type.UNICODE_STRING);
        tableDef.addColumn("country_mfg",         Type.UNICODE_STRING);
        tableDef.addColumn("hazard",        Type.UNICODE_STRING);
        tableDef.addColumn("manufacturer",           Type.UNICODE_STRING);
        tableDef.addColumn("prname",        Type.UNICODE_STRING);
        tableDef.addColumn("recDate",           Type.UNICODE_STRING);
        tableDef.addColumn("recallNo", Type.UNICODE_STRING);
        tableDef.addColumn("recallURL", Type.UNICODE_STRING);
        tableDef.addColumn("type", Type.UNICODE_STRING);
        tableDef.addColumn("y2k", Type.UNICODE_STRING);
        return tableDef;    }
     private static void parseRecalls(Table table, String startDate, String endDate) throws Exception    {
           String insertItem = " ";
           TableDefinition tableDef = table.getTableDefinition();
           //URL to obtain recalls XML data - added params for the start and end date so they can be passed in from the main method
        URL url = new URL("http://www.cpsc.gov/cgibin/CPSCUpcWS/CPSCUpcSvc.asmx/getRecallByDate?startDate="+startDate+"&endDate="+endDate+"&userId=test&password=test");
        URLConnection connection = url.openConnection();
        //After examining the xml structure, determined the level needed, iterate to the XML node level needed
        Document doc = parseXML(connection.getInputStream());
        NodeList first = doc.getChildNodes();
        NodeList second = first.item(0).getChildNodes();
        NodeList third = second.item(1).getChildNodes();
        for(int i=0; i<third.getLength();i++)
        {
           //result rows have recalls data in the xml, parse them into the table
           if (third.item(i).getNodeName()=="result") {
                NamedNodeMap attr = third.item(i).getAttributes();
                System.out.println("Wrote line "+i +" into .tde file");
                Row row = new Row(tableDef);
                for (int x=0; x < attr.getLength(); x++) {
                      if (attr.item(x).getNodeValue().length()<1)
                           insertItem = "NULL";
                       else
                      insertItem = attr.item(x).getNodeValue();
                      row.setString(x, insertItem);
                }
                table.insert(row);
           }
        }
        tableDef.close();
    } 
private static Document parseXML(InputStream stream)
               throws Exception
               {
                   DocumentBuilderFactory objDocumentBuilderFacto
y = null;
                   DocumentBuilder objDocumentBuilder = null;
                   Document doc = null;
                   try
                   {
                       objDocumentBuilderFactory = DocumentBuilderFactory.newInstance();
                       objDocumentBuilder = objDocumentBuilderFactory.newDocumentBuilder();
                       doc = objDocumentBuilder.parse(stream);                   }                   catch(Exception ex)   {                       throw ex;                   }                         return doc;
               }
      public static void main(String[] args)
   {                //start and end date args for the recalls data as yyyy-mm-dd, for example, 2014-12-31
           String start = args[0];
           String end = args[1];
           //path to .tde
           Path path = Paths.get("C:\\recallsTDE\\recalls-java.tde");
           try {
                //remove any prior version of the .tde
                Files.deleteIfExists(path);
           } catch (IOException e) {
                e.printStackTrace();
           }
           try (Extract extract = new Extract("C:\\recallsTDE\\recalls-java.tde")) {
                Table table;
                    TableDefinition tableDef = makeTableDefinition();       
                    table = extract.addTable("Extract", tableDef);
                parseRecalls(table,start,end);
        } catch (Throwable t) {
            t.printStackTrace(System.err);
        }
    }
}

The next step was a bit more tricky, as it was not documented anywhere I could find. How to actually use the .tde file in a tableau server environment so that dashboards can be created off it and refreshed automatically? After experimenting with multiple methods, I settled on the following approach: run the extract program as a runnable jar on a server and then use the tabcmd API to publish the data source into my tableau server. The .bat file I created to run the runnable jar and export the .tde into the server looks like so..:

cd C:\recallsTDE
java -jar "C:\recallsTDE\recalls-java.jar" 2000-01-01 2020-12-31
tabcmd publish "C:\recallsTDE\recalls-java.tde" -o -s http://[my.tableau.server.ip] -u [myTableAdmin] -p [myTableauAdminPwd] -t [mySite]

My runnable jar, recalls-java.jar, sits on the C drive in a directory called  recallsTDE. It takes the argument 2000-01-01 for the first date to look for recalls from the government web site and 2020-12-31 is the end date.

After the java program finishes running and the .tde is created, it is published to the server with the tabcmd command, which you can lookup as well. Documentation for it is par I guess, but you can kind of make your way through it, it is fairly intuitive.

I put this .bat file into a windows schedule which runs daily and now I have my automatically refreshable tableau server data connection to work with.

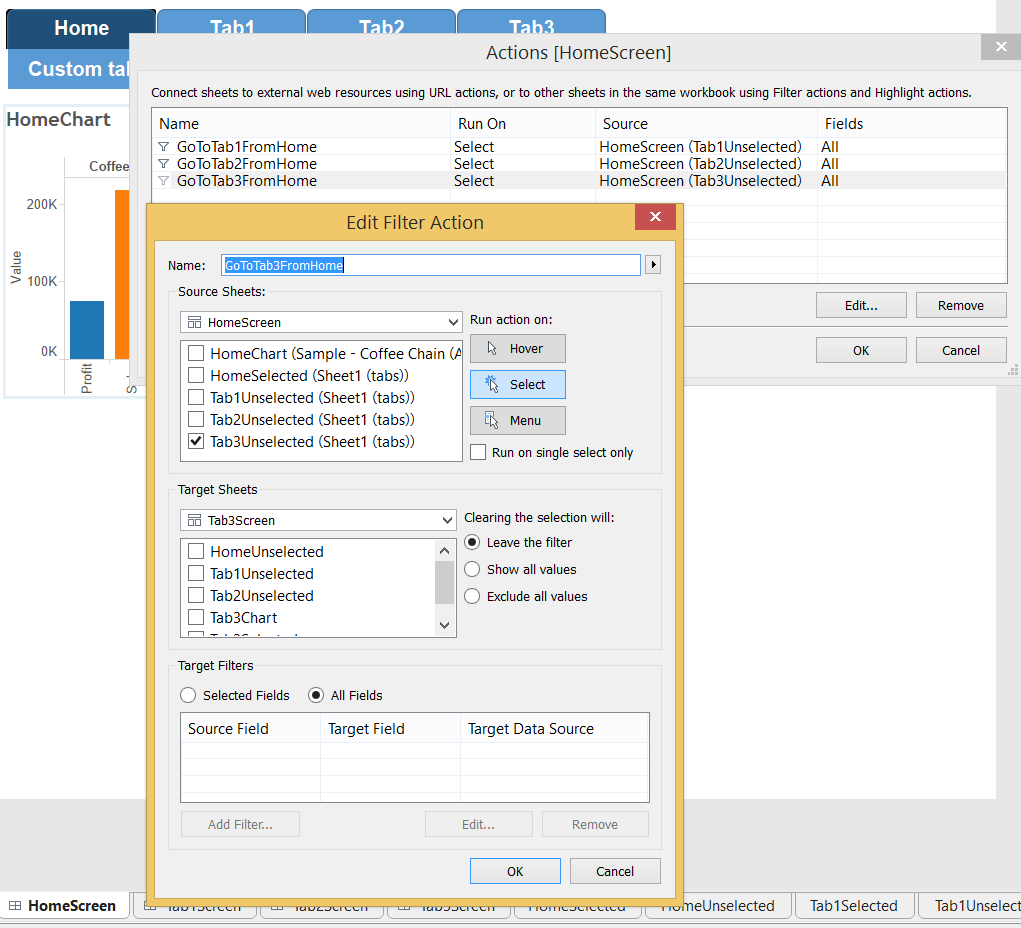
The next step was of course to create the dashboard in tableau desktop from the data.

And the final step was to leverage the trusted authentication setup I have with our front facing servers (since tableau server sits behind the firewall) to expose the dashboard via a URL that will bypass the login screen. Here is the code for that step as well:

<%@page session="false"%>
<%@page import="java.net.*,java.io.*" %>
<%
String user = "[TableauUserWithAccessToDashboard]";
        String wgserver = "[TableauServerAddress – internal]";
        String dst = "views/[workbook]/[view]";
        String params = ":embed=yes&:toolbar=no&:tabs=no&:refresh";
String ticket = getTrustedTicket(wgserver, user, request.getRemoteAddr());
        if ( !ticket.equals("-1") ) {
            response.setStatus(HttpServletResponse.SC_MOVED_TEMPORARILY);
            response.setHeader("Location", "http://server/trusted/" + ticket + "/t/site/" + dst + "?" + params);
        }
        else
            // handle error
            throw new ServletException("Invalid ticket " + ticket);
%>
<%!private String getTrustedTicket(String wgserver, String user, String remoteAddr)
        throws ServletException
    {
        OutputStreamWriter out = null;
        BufferedReader in = null;
        try {
            // Encode the parameters
            StringBuffer data = new StringBuffer();
            data.append(URLEncoder.encode("username", "UTF-8"));            data.append("=");
            data.append(URLEncoder.encode(user, "UTF-8"));
            data.append("&");
            data.append(URLEncoder.encode("client_ip", "UTF-8"));
            data.append("=");
            data.append(URLEncoder.encode(remoteAddr, "UTF-8"));
            data.append("&");
            data.append(URLEncoder.encode("target_site", "UTF-8"));
            data.append("=");
            data.append(URLEncoder.encode("Site2", "UTF-8"));
            // Send the request
            URL url = new URL("http://" + wgserver + "/trusted");
            URLConnection conn = url.openConnection();
            conn.setDoOutput(true);
            out = new OutputStreamWriter(conn.getOutputStream());
            out.write(data.toString());
            out.flush();
             // Read the response
           StringBuffer rsp = new StringBuffer();
            in = new BufferedReader(new InputStreamReader(conn.getInputStream()));
            String line;
            while ( (line = in.readLine()) != null) {
                rsp.append(line);
            }
            return rsp.toString();
        } catch (Exception e) {
            throw new ServletException(e);
        }
        finally {
            try {
                if (in != null) in.close();
                if (out != null) out.close();
            }
            catch (IOException e) {}
        }
    }
%>

And there you have it. Enjoy!

Posted in Data visualization, Tableau, Uncategorized | Tagged , , , | 1 Comment

Don’t let the software migration cycle cripple your BI project

speedbumps

Software developers have been taught for decades that they must follow the Development/Integration/Staging/Production practice. This practice was instituted to minimize the number of “bugs” in the software and allow for rigorous testing of code changes without “interfering with production”. This practice was quickly adopted by IT departments and is now the practical standard followed by organizations large and small. While BI straddles the line between technologists and business folks, it is typically controlled by the organization IT/IS/Development department (it requires software and hardware..) and as such, the development of BI content is approached in the same fashion as any traditional software project: we develop in dev system, we integrate in a shared environment with limited datasets, we test and stage in an environment close to prod, and we finally deploy to production. There are of course variations on this theme, but most of you are very familiar with this rant. Unfortunately, this approach has a crippling effect on BI content development, which typically needs to be very rapid, often does not need “accounting accuracy” and is very difficult and expansive to replicate across multiple systems.

First, there’s speed. Burning business questions cannot wait for months, or even weeks, while reports or queries are being migrated through various systems designed to work as a chain of error catching nets. Some margin of error is allowed (and even assumed) when it comes to many business questions (more on this on the next point). To make things even worst for IT departments struggling to keep up with the ever increasing speed of the demand, most BI vendors provide self-service and ad-hoc capabilities that allows savvy business users to design their own reporting content. This increases the frustration of business folks, waiting for weeks and months for changes or development of new content, after they experience the development of ad-hoc content in minutes or hours.

Second, there’s the typical need for directional accuracy as opposed to pennies accounting. For many computer scientists (and accountants), accuracy is an absolute term. In business however, things are usually not as clear cut, and some information is better than none. So, obsessing over each data anomaly and assuring there are no mistakes what-so-ever, is not only impossible when it comes to large amounts of data generated by complex systems (and complex humans), it can lead to stagnation in the process, as “every penny” is being reconciled, and focus is placed on fractional amounts of information, while the millions or billions of correct results are ignored, and left to wait for the next “release date” when all bugs can be fixed.

Finally, with large systems, and large amounts of data, it is virtually impossible (or at least very very expensive) to reproduce the entire production data in any other environment. There is simply too much of it to have copies. This fact intensified by the need for speed, and the ability to “let go” of the penny accounting approach to the data also supports the need to “skip” the migration cycle for BI content development.

Moreover, other than in very rare cases, BI content is based on reading data only. Even interactive BI content (such as dashboards, or interactive reporting) is based on data reading only. Most BI vendors make it almost impossible to change data while using their tools, so the risk of causing any kind of “damage” to systems by writing changes to database is not a problem as well.

There are cases where BI content development can benefit from following the typical software migration practice, but in most cases it suffers. And if internal technology departments want to keep up with their internal demand, they need to adapt to a more rapid approach to BI content development.

Posted in BI At Large | Tagged | Comments Off on Don’t let the software migration cycle cripple your BI project

Embedding Tableau Dashboards

I delivered a webcast about embedding tableau dashboard in external facing apps, and embedded BI in general. You can view the webcast recording at the following address, or checkout the slides that accompanied the webcast here.

Posted in BI At Large, Data visualization, Tableau | Tagged , , | Comments Off on Embedding Tableau Dashboards

Embedded Tableau Oscars Dashboard

oscarsdash

A few months ago I published my Oscars dashboard (http://bihappyblog.com/2014/03/10/oscars-dashboard/). Recently, I decided to produce a new version of it, leveraging Tableau, and extending it with some additional features possible with some html5 integration. Embedding Tableau in an external web application framework is a great way to leverage Tableau terrific data exploration features like drilling, grouping and filtering with some intuitive, simple to understand and use interface suitable for a user’s portal or an executive audience. This example leverages my Oscars database file and allows exploration of Oscar nominated actors, actresses, directors as well as a free form exploration option for perusing more of the data set. Click the image above to interact with the full version. Enjoy..

Posted in Data visualization, HTML5, Tableau | Tagged | Comments Off on Embedded Tableau Oscars Dashboard

Tableau connected Medicare enrollment dashboard

tableau_medicare_dashboard

Our medicare enrollment database continues to grow and now contains over 9M enrollment records from across the country. I began collecting this information almost two years ago with my colleague Josh Tapley, and we used it to produce our medicare advantage dashboards using the SAP Dashboards (Xcelsius) tool, as well as our HTML5 reporting solution. Aside from being an interesting dataset, relevant to medical insurance professionals and anyone else interested in medicare and healthcare, this platform provides us the medium to demonstrate many technical advantages and techniques we often solve on projects. So, to add to our arsenal or medicare advantage dashboards, I have now added a Tableau version. This version looks and operates just like it’s siblings from SAP and our custom HTML solution, however uses completely different technology under the covers. To create it, we had to overcome several interesting challenges, from the ability to serve up Tableau content from our secure server which resides behind our firewall via secure proxy to the internet, addressing proxying, authentication and security challeneges to the ability to create visuals which do not exist natively in the tool, such as a donut chart. This dashboard is connected to the live data, and executed a query each time a state is selected. This design pattern is consistent across all three versions of this dashboard and is designed to demonstrate the ability to work with these dashboarding tools in a completely “hands free” no hassle, and no maintenance mode, where data is refreshed in the database and automatically reflected in the dashboard with no need for any intervention. Enjoy.

Posted in Data visualization, HTML5, Tableau | Tagged , | Comments Off on Tableau connected Medicare enrollment dashboard

Using Webi 4.1 SDK to get Report SQL

sql

When SAP introduced BusinessObjects 4.0, clients who were invested in the Webi REBEAN SDK got worried. The Webi SDK had been mostly deprecated and it was not clear what is going to be the direction for those seeking programmatic ways to interact with webi reports. Well, in 4.1, the Webi SDK has made a big come back, and with a modern, web friendly architecture. Webi reports can now be modified, explored and edited programmatically via RESTFUL calls. In a prior post, I wrote about the ability to logon to the BO enterprise platform via REST web services, and building on this example, I took the 4.1 SP2 SDK for a spin. The use case I wanted to address was the extraction of the SQL query from a webi report. This is a use case I run into often, especially when working on dashboards projects where database developers who have no idea (or interest) in webi are looking to get their hands on the SQL queries being used to generate dashboard screens (via BI services). To accommodate this, I was looking for a way to expose the query from the webi data provider programmatically, via a simple hyperlink in the dashboard.

In this example, the service is implemented as a .jsp file on the BO tomcat server. As explained in the first post, we have to work around the domain-of-origin issue, and a java proxy seemed to be the way to go here, though other approaches are feasible.

The actual code to retrieve the sql query of the webi report is below:

<%@include file="getlogin.jsp" %>
The getlogin.jsp file basically uses the logon code from the first post and saves the generated logon token to the session. That way, the logon token can be used for subsequent operations easily…
<%@ page import="
org.apache.http.HttpEntity,
org.apache.http.HttpResponse,
org.apache.http.client.methods.HttpPost,
org.apache.http.client.methods.HttpGet,
org.apache.http.impl.client.DefaultHttpClient,
org.apache.http.util.EntityUtils,
org.apache.http.entity.StringEntity,
org.apache.http.client.HttpClient,
org.apache.http.protocol.BasicHttpContext,
org.apache.http.HttpStatus,
java.io.*,
java.net.*,
org.apache.http.Header,
org.apache.http.impl.client.BasicResponseHandler,
org.json.simple.*,
org.json.simple.parser.*"
%>
<%@page contentType="text/json"%>
<%@page trimDirectiveWhitespaces="true" %>
<%
String reportId = request.getParameter("id");// allow passing a report id as a query string from the dashboard
if (reportId==null) reportId = "7749"; //catchall in case no id is passed
StringBuffer sbf = new StringBuffer();
 HttpGet httpRequest = new HttpGet("http://localhost:6405/biprws/raylight/v1/documents/"+reportId+"/dataproviders/DP0");//in this example, there is one data provider for the report, if there are multiple, you will need to explore them and find their names in order to query each one separately
 httpRequest.setHeader("Content-Type","application/json");
 httpRequest.setHeader("Accept","application/json");
 String logonToken = "";
 logonToken = (String) session.getAttribute("logonToken");
 httpRequest.setHeader("X-SAP-LogonToken",logonToken);
HttpClient httpclient = new DefaultHttpClient();
 HttpResponse httpResponse = httpclient.execute(httpRequest);
if (httpResponse.getStatusLine().getStatusCode() == HttpStatus.SC_OK && httpResponse.getEntity() != null) {
 HttpEntity ent = httpResponse.getEntity();
 BufferedReader in = new BufferedReader(new InputStreamReader(ent.getContent()));
 String inputLine;
 while ( (inputLine = in.readLine()) != null) sbf.append(inputLine);
 in.close();
 EntityUtils.consume(ent);
 } else {
 out.println("error: "+ httpResponse.getStatusLine().getStatusCode());
 Header[] headers = httpResponse.getAllHeaders();
 for (Header header : headers) {
 out.println("Key : " + header.getName() 
 + " ,Value : " + header.getValue());
 }
 HttpEntity entity = httpResponse.getEntity();
 String responseString = EntityUtils.toString(entity, "UTF-8");
 out.println(responseString);
}
 %>
<%
String jsonStr = sbf.toString();
Object obj=JSONValue.parse(jsonStr);
JSONObject array = (JSONObject)obj;
JSONObject obj2=(JSONObject)array.get("dataprovider");
out.println(obj2.get("query")); 
%>
Posted in BI At Large, BusinessObjects 4.0, Web Intelligence | Tagged , , | 1 Comment

Nulls are evil (or at the very least mischievous)

If you have been involved in hands on database development for a while, or in any kind of BI / reporting initiative, you probably already know this. Nulls are evil (or at the very least mischievous).
A null value in a database column is different than a blank, a white space or any multitude of other invisible characters. It is truly void, nothingness, the abyss…
The implications of leaving null values can be very confusing for downstream reporting development. Null values will cause problems when trying to aggregate numeric values, they will make joins fall apart and complicate the querying of any table where null values are involved. As a case in point, I set out to demonstrate below how four major databases handle (or not handle..) null values. The answer is the same in each case.
The use case I created is simple:
I created a table with 8 records in it. 2 of the records are null values. Then I queried the database with three simple questions:
• How many values are there where the value is not ‘a’ – since one record has a value of a, I expected the answer to be 7
• Given a wild card search on the value, provide all records – I expected to get 8 records back from a “wild card” search on all records
• How many records are there in the table, counting the value field – I expected 8
All databases gave the same answer:
How many values are there where the value is not ‘a’ – 5. The 2 null values were not considered
Given a wild card search on the value, provide all records – 6. The null records were ignored.
How many records are there in the table, counting the value field – 6. Yes, the database simply does not count the null values, as if they did not exist. Real nothingness…
Below are the test results in Oracle, SAP HANA, mySql and Sql Server. Beware of nulls…
create table test_nulls (column_a varchar(255));
insert into test_nulls (column_a) values (‘a’);
insert into test_nulls (column_a) values (‘b’);
insert into test_nulls (column_a) values (‘c’);
insert into test_nulls (column_a) values (null);
insert into test_nulls (column_a) values (‘f’);
insert into test_nulls (column_a) values (‘g’);
insert into test_nulls (column_a) values (‘h’);

Oracle:
select * from test_nulls;
ora01
select * from test_nulls where column_a <> ‘a’;

ora02
select * from test_nulls where column_a like ‘%’;
ora03
select count(column_a) from test_nulls;
ora04
HANA:
create column table test_nulls (column_a varchar(255));
insert into test_nulls (column_a) values (‘a’);
insert into test_nulls (column_a) values (‘b’);
insert into test_nulls (column_a) values (‘c’);
insert into test_nulls (column_a) values (null);
insert into test_nulls (column_a) values (‘f’);
insert into test_nulls (column_a) values (‘g’);
insert into test_nulls (column_a) values (‘h’);

select * from test_nulls;
hana01
select * from test_nulls where column_a <> ‘a’;
hana02
select * from test_nulls where column_a like ‘%’;
hana03
select count(column_a) from test_nulls;
hana04
MySQL
select * from test_nulls;
mysql01
select * from test_nulls where column_a <> ‘a’;
mysql02
select * from test_nulls where column_a like ‘%’;
mysql03
select count(column_a) from test_nulls;
mysql04
Sql Server
select * from test_nulls;
sqlserver01
select * from test_nulls where column_a <> ‘a’;
sqlserver02
select * from test_nulls where column_a like ‘%’;
sqlserver03
select count(column_a) from test_nulls;

sqlserver04

Posted in BI At Large, Data Warehousing, SAP HANA | Tagged , | Comments Off on Nulls are evil (or at the very least mischievous)

Oscars dashboard

oscars


I LOVE movies. I am fascinated by the craft of creating movies. It’s a field that combines technology and imagination in very unique ways and where science and art interact to create an amazing product (well, not always, but many times..). As millions of others, I enjoy the yearly Oscars awards which allows  us who enjoy watching the movies to view the people who are responsible for the creation we enjoy in a different light. So, this year, I set out to explore the Oscars from a BI perspective. I began by going to the Oscars.org web site and obtained an extract of the nominations and winners data since the first award show in 1927. The Oscars.org web site makes this data public, however the data is presented in a format that is very un friendly for analysis beyond observation on a web page. So, the first task I faced was transforming the data into a format I can load into a BI tool that can be used to mine the data.

Next, I leveraged some of the new features available in SAP Web Intelligence (Webi) 4.1 to create a visual interactive dashboard that is completely HTML based (will work on any device) and is both visually appealing as well as interactive (with the Search capabilities). Use the Search functionality to look for your favorite actor/s or any other film related terms to see how many times they were nominated and/or won. Feel free to click the image above to link to the live Oscars dashboard. If you have other interesting ideas for Oscars related data visualization, please let me know, I would be delighted to share my Oscars data file!

Posted in BI At Large, Data visualization, HTML5, SAP Mobile BI, Web Intelligence | Tagged , | 3 Comments

Signal and Noise inspired dashboard

Reading Nate Silvers’ “The Signal and the Noise: Why So Many Predictions Fail — but Some Don’t” (amazon link to book) inspired me to create this dashboard to articulate the idea of searching for signal and meaningful insights in the noise of the data. This is the html5 output from an xlf, feel free to download the .xlf used to produce it

Posted in BI At Large, Data visualization, HTML5, SAP Mobile BI, Xcelsius | Tagged , , | Comments Off on Signal and Noise inspired dashboard