BI Happiness with html5 charts animation

The other day, my colleague Rob Blackburn wrote a really cool and elegant function to animate html5 charts for our dashboards. It was so cool, that it even made my scatter charts smile…

Posted in Data visualization, HTML5 | Tagged | Comments Off on BI Happiness with html5 charts animation

How I loaded my blog into HANA (and what I learned about it once it was there…)

Unstructured data analysis is one of the most interesting aspects of “big data”. It’s certainly impressive to be able to process massive amounts of structured data in no time, but analyzing unstructured data opens completely new possibilities, that can lead to the creation of whole new disciplines or industries. To test out HANA text analysis capabilities, I thought I would try to load my blog into a column table, and see what it can do.
Leveraging my company AWS HANA instance, I started out by making a simple single column table. The important thing to note here is that for text analytics to work, the data type to be used has to be NCLOB. BLOB for example, will not work.
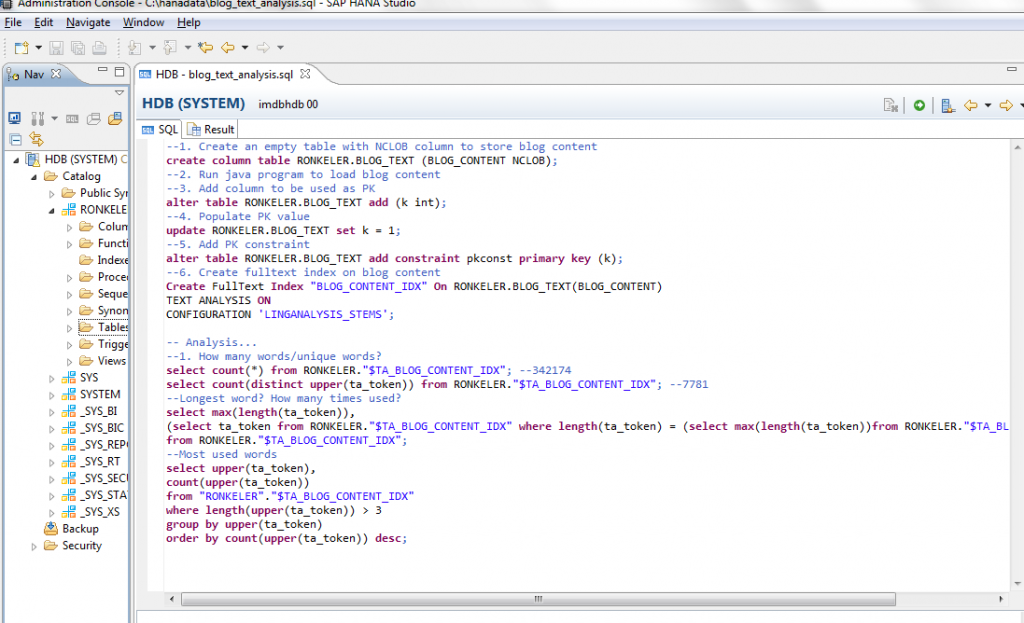
So, in HANA studio, after connecting to the HANA instance and my schema, I executed:

--1. Create an empty table with NCLOB column to store blog content
create column table RONKELER.BLOG_TEXT (BLOG_CONTENT NCLOB);

The next step was a bit more interesting. How do I actually load my blog into the table…? Well. First, I had to get my blog out to a file. Since I use wordpress, that was as simple as selecting the Export option from the Tools menu of the administration section.

With my blog exported as an xml file, I set my sights on loading it into my table. Data Services would be my typical choice, as it’s fast, easy to use, and has great integration with HANA. However, to keep my options open, I looked for a programmatic solution that will allow more robust capabilities. And as it turns out, the solution was similar to loading a blob object into any other database. I ended up writing a small java program to load the file in.
To connect to HANA in java, I needed to find the ngdbc.jar library and add it to my project build path in Eclipse. The rest was pretty standard:

import java.io.*;
import java.sql.*;
public class HanaConn {
 public static void main(String args[]) {
  try {
   File f = new File("C:\\FOLDER\\FILE.xml");
   InputStream is = new FileInputStream(f);
   Class.forName("sun.jdbc.odbc.JdbcOdbcDriver");
   java.sql.Connection conn = DriverManager.getConnection(
     "jdbc:odbc:imdbhdb", "SYSTEM", "PWD");
   conn.setAutoCommit(false);
   PreparedStatement stmt = conn
     .prepareStatement("INSERT INTO RONKELER.BLOG_TEXT VALUES(?)");
   stmt.setBinaryStream(1, is, (int) f.length());
   stmt.executeUpdate();
   conn.commit();
   is.close();
   System.out.println("Done inserting!");
   stmt.close();
   conn.close();
  } catch (Exception e) {
   System.out.println("Exception occured: " + e.getMessage());
   e.printStackTrace();
  }
 }
}

So, step 2

--2. Run java program to load blog content

Next, I modified my table to add a primary key. Using the text analytics requires the analyzed table have a PK:

--3. Add column to be used as PK
alter table RONKELER.BLOG_TEXT add (k int);
--4. Populate PK value
update RONKELER.BLOG_TEXT set k = 1;
--5. Add PK constraint
alter table RONKELER.BLOG_TEXT add constraint pkconst primary key (k);

So far, things have been pretty standard. The cool part was turning on the text analytics. Using one simple SQL command, HANA processed the content of my text column, and parsed it out in nano seconds!

--6. Create fulltext index on blog content
Create FullText Index "BLOG_CONTENT_IDX" On RONKELER.BLOG_TEXT(BLOG_CONTENT)
TEXT ANALYSIS ON
CONFIGURATION 'LINGANALYSIS_STEMS';

This query generated a table called $TA_BLOG_CONTENT_IDX. This table included a row for each word in my blog, allowing me to then run some queries to perform analysis on the content of my blog..:

-- Analysis...
--1. How many words/unique words?
select count(*) from RONKELER."$TA_BLOG_CONTENT_IDX"; --342174 words! Wow, who knew i wrote so much...
select count(distinct upper(ta_token)) from RONKELER."$TA_BLOG_CONTENT_IDX"; --7781 unique words... Maybe i need to read more to expand my vocabulary..
--Longest word? How many times used?
select max(length(ta_token)),
(select ta_token from RONKELER."$TA_BLOG_CONTENT_IDX" where length(ta_token) = (select max(length(ta_token))from RONKELER."$TA_BLOG_CONTENT_IDX"))
from RONKELER."$TA_BLOG_CONTENT_IDX"; --54;VbZDUzY2M2ZDQtYzNmMC00OTJjLTlhMDUtNDU3MGMyY2ZkOWZm&amp well, not really a word, but you get the idea
--Most used words
select upper(ta_token),
count(upper(ta_token))
from "RONKELER"."$TA_BLOG_CONTENT_IDX"
where length(upper(ta_token)) > 3
group by upper(ta_token)
order by count(upper(ta_token)) desc; -- Well, need to do some more with this, but Xcelsius and Webi were pretty high up on the list

Of course, this is a tiny example, but the ability to store and quick and easily parse text can be an important feature in any HANA implementation. From social media content to corporate documents, this is a game changer!

Posted in SAP HANA | Tagged , , , | Comments Off on How I loaded my blog into HANA (and what I learned about it once it was there…)

Use SAP BI Publications to solve complex content delivery processes

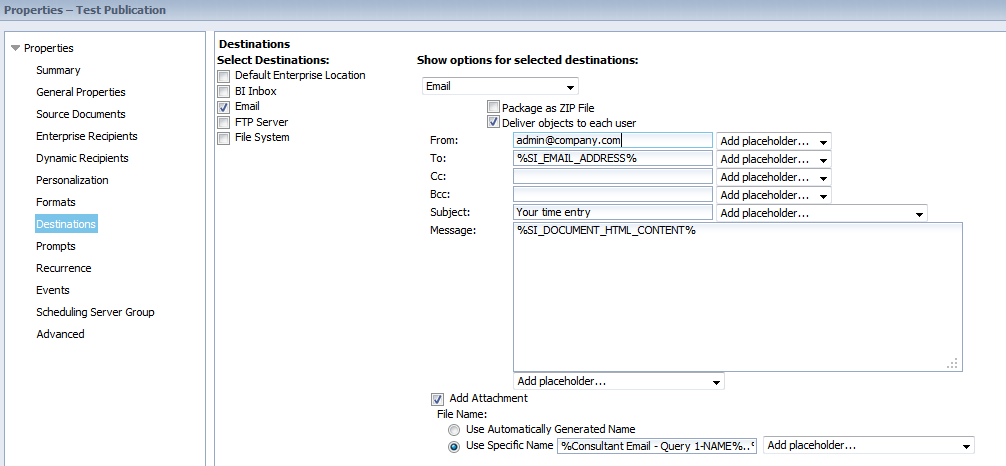
One of the most important, and less understood or used, featured of the SAP BI platform (BusinessObjects) is the Publication feature. Publications are essentially a “mass mailing” tool, that allows BI content developers to develop highly sophisticated, personalized and robust delivery mechanism of content directly to users email boxes. In particular, the dynamic recipient list flavor of publications, allow BI users to deliver reporting content to email lists, regardless of whether they are users of the BI platform. This content can be personalized, and delivered based on data driven rules to each user. What this spells is a very powerful, simple and easy to use, mechanism to address many business process issues related to information delivery. Let me describe a case in point:

A professional services firm charges for hours worked by consultants, therefor, timely time entry of consultants’ billable hours is critical to the business operation. To assure consultants do not miss the time entry deadline each week, we can use a publication. How does it work?

The time entry system has a table of users, and their email addresses, as well as table for collecting time entry data with hours entered by week and day.

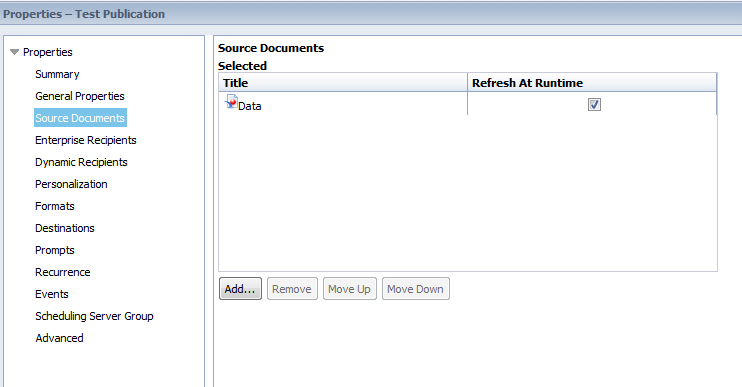
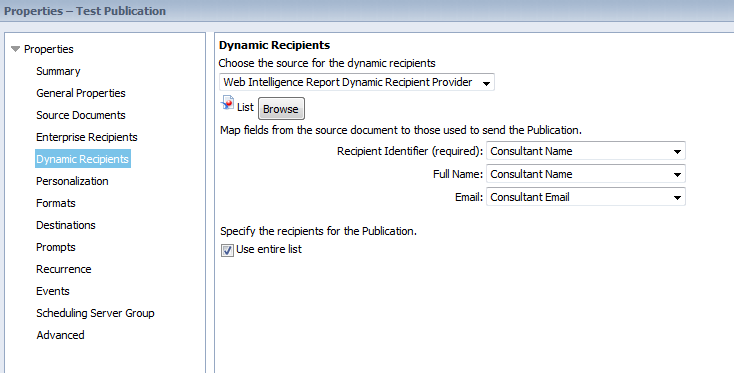
Two webi reports have been setup to support the publication: the first report is used to generate the dynamic recipient list. The report contains the three required columns for such a list (ID, Name, Email) and has a filter that only retrieves users who are missing time entry for the prior week.

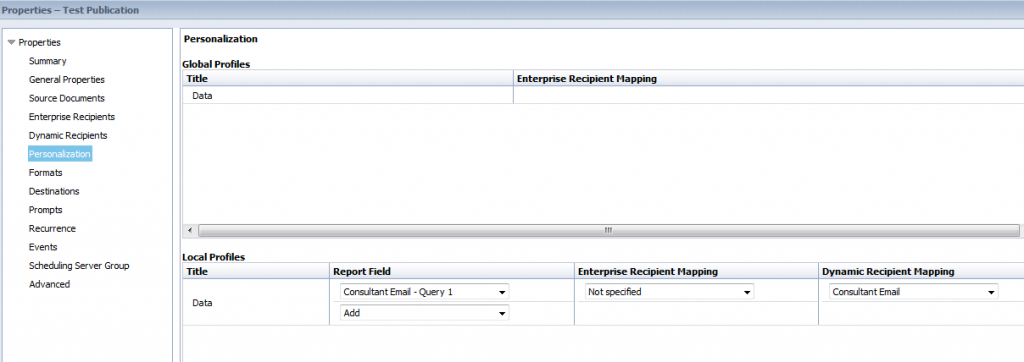
A second report, which will be used as the actual content to send to the users, was also created with the users email address (will be used to personalize the publication and “link” the distribution list to the report), and some text asking the user to enter their time for the missing week.

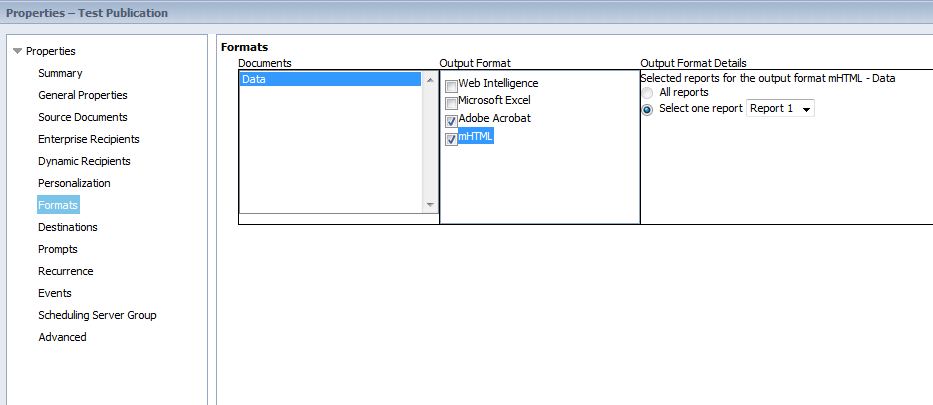
With the two reports ready to go, all that is left, is the publication setup. The following screen shots describe the publication creation setup. In this case, the mHTML format was used to deliver the report content right in the email body for the users. Enjoy!


Posted in BusinessObjects 4.0 | Tagged , | 2 Comments

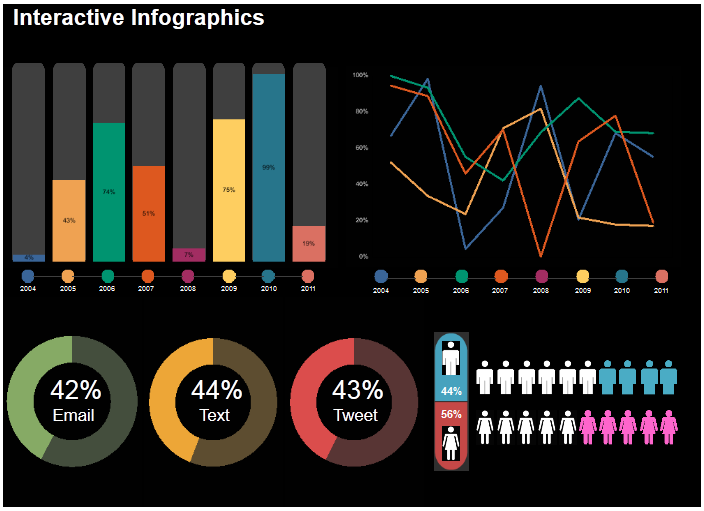
Infographic style crystal report

In a continued effort to demonstrate the capabilities of the various BusinessObjects reporting tools as adequate in the user interface area, i created this info graphic style crystal report. This report is modeled after my colleague’s Josh Tapley original InfoGraphic Style dashboard, and follows my example of the InfoGraphic style Webi. All this is simply a demonstration of the visual capabilities of these tools, and a statement of BI Happiness that declares that delivering data to users DOES NOT have to be ugly, boring and difficult. To be successful, users must WANT to use the reports, with no users adoption, any BI project is doomed. In this example, a crystal report was used, leveraging images and formatting options, as well as the RAS SDK with a custom viewer to embed the reports in a seamless fashion in a web page. Enjoy!

Posted in BusinessObjects 4.0, Crystal Reports, Data visualization | Tagged , , | Comments Off on Infographic style crystal report

H + The Digital Series – animated interactive timeline chart

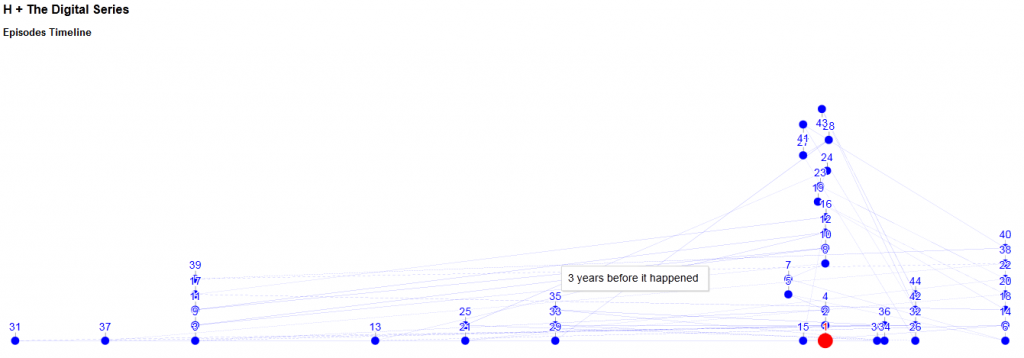
A colleague at work recently told me about the web series H +. It sounded interesting, so i went to check it out, and was instantly hooked! For me, this was a brand new genre, and one that fits the new connected world we live in perfectly. Each episode in the series is 3-6 minutes long, so you can watch the episodes in all kinds of time configurations. The story is thrilling, the production is superb, and the whole experience is riveting. One of the interesting things about the series is the way the plot unfolds, where each episodes jets the viewer into a different time slot, related to “the event” (i really don’t want to spoil anything…). So in an effort to try and put the pieces together, i created an animated line chart that plots the episodes timeline. Click on the image below to view the animation and mouse over the data points to get episodes info. Enjoy..


Posted in BI At Large, Data visualization, HTML5 | Tagged , , , , , | 1 Comment

Recalls dashboard

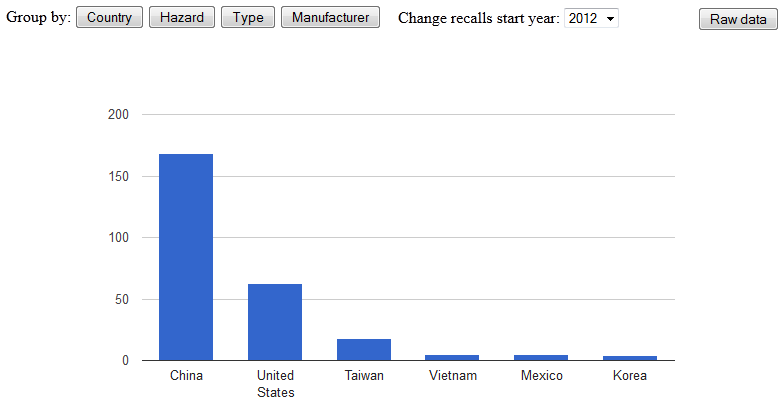
The Consumer Product Safety Commission (http://www.cpsc.gov/) collects and publishes information about product recalls. The department made its database of recalls information available to the public as a web service, which means we can have fun with this data… Leveraging our html5 dashboarding framework, I created a dashboard that consumes the web service (allows user to select start year for the recalls data) and aggregates the number of recalls based on user selected attributes (like country or manufacturer). The chart display shows categories that had 4 or more recalls in the selected time frame, the Raw Data view dumps the entire data set on the screen. This is interesting stuff.. Enjoy!

Posted in BI At Large, Data visualization, HTML5 | Tagged , , | Comments Off on Recalls dashboard

Play the pie chart Dreidel

This Saturday is the first night of Chanukah, the Jewish “festival of lights” holiday. One of the games kids play during this holiday is called Dreidel. The Dreidel is essentially a top that has four Hebrew letters marked on four sides. To play the game, kids spin the Dreidel and while it spins, they pick a letter from the four possible options. When the Dreidel stops, whoever picked the letter the Dreidel landed on, wins. In the spirit of the holiday, and since I have been working with Xcelsius SP5 and some of its new mobile features, I created a simple pie chart Dreidel game… Enjoy and happy holidays!

Posted in BI At Large, Xcelsius | Tagged | Comments Off on Play the pie chart Dreidel

Infographic style webi

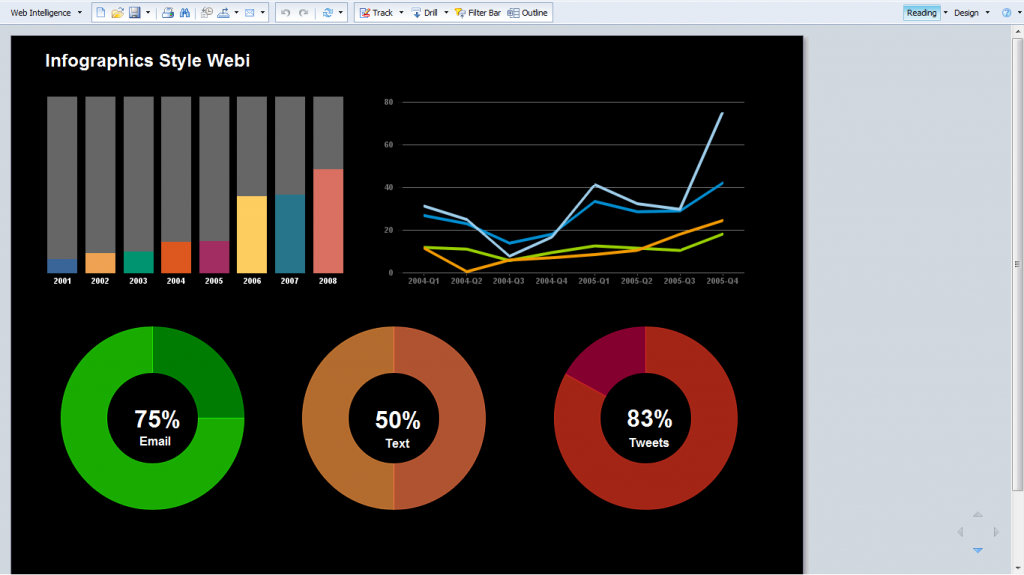
Web Intelligence reports are often thought of as boxy, ad-hoc’ish, somewhat sloppy collections of tables and charts. Of course, when creating quick ad-hoc analysis queries, that is completely appropriate, but when designing corporate reports for disseminating information in a way that will appear to the information consumers, webi provides all the tools of any top notch reporting application to create visually stunning presentation that can engage and tell a story.
To make this point, i looked at my colleague, Josh Tapley blog, data-ink, and found two of his stunning examples of reports and dashboard design. Josh used Xcelsius and our HTML5 dashboarding solution to create contemporary, info graphic style presentations. I used his design to produce a webi report that follows the same pattern, and i think the result can be quite compelling, certainly not your average webi report… Enjoy.

Posted in BusinessObjects 4.0, Web Intelligence | 1 Comment

BusinessObjects 4.0 RESTful web service proxy

SAP introduced RESTful web services in its BI platform (BusinessObjects 4.0) for the first time in the latest service pack SP4. This is a first step in a good direction. The rest web services available in the platform are a bit limited yet, but indicate an important directional shift. Up to now, all we had to work with was soap. The rest web services allow developers to obtain a logon token and perform basic scheduling operations. The crystal RESTful sdk has some additional possibilities in terms of access to reports and data. I decided to take the RESTful web services for a spin, and right off the bat, ran into problems…
First of all, the services are deployed on the WACS (the web application container service), as opposed to the web server that the rest of the app runs on (typically Tomcat). So if you were planning to make a simple ajax call to the logon service to obtain a logon token, you can forget about it. Same origin policy will prevent your web client from accessing ajax content from a different host, and technically, even though you might be deploying your code on the same machine as the bo Tomcat, the WACS will run on a different port, so you are out of luck.
To work around that, i wrote a jsp proxy that connects to the logon service and displays the response xml. The trick was to get the post request to look just right for the service to accept it, but once i got that, the rest is simple. You can grab this code, put it in a webapp on the bo server, and now you can call this proxy using ajax to obtain a token and pass it to other applications that need to integrate with BO. Sweet.

<%@ page
    import="org.apache.http.HttpEntity,
  org.apache.http.HttpResponse,
  org.apache.http.client.methods.HttpPost,
  org.apache.http.impl.client.DefaultHttpClient,
  org.apache.http.util.EntityUtils,
  org.apache.http.entity.StringEntity,
  org.apache.http.client.HttpClient,
  org.apache.http.protocol.BasicHttpContext,
  org.apache.http.HttpStatus,
  java.io.*,
  java.net.*"
%>
<%@page contentType="text/xml"%>
<%@page trimDirectiveWhitespaces="true" %>
<%
//for debugging the post request, very useful...
//System.setProperty("org.apache.commons.logging.Log","org.apache.commons.logging.impl.SimpleLog");
//System.setProperty("org.apache.commons.logging.simplelog.showdatetime","true");
//System.setProperty("org.apache.commons.logging.simplelog.log.org.apache.http","DEBUG");
//System.setProperty("org.apache.commons.logging.simplelog.log.org.apache.http.wire","DEBUG");
String user = "";
String pwd = "";
 StringBuffer sbf = new StringBuffer();
 String xmlString = "<attrs xmlns=\"http://www.sap.com/rws/bip\"><attr name=\"userName\" type=\"string\">"+user+"</attr><attr name=\"password\" type=\"string\">"+pwd+"</attr><attr name=\"auth\" type=\"string\" possibilities=\"secEnterprise,secLDAP,secWinAD\">secEnterprise</attr></attrs>";
 HttpPost httpRequest = new HttpPost("http://localhost:6405/biprws/logon/long");
 httpRequest.setEntity(new StringEntity(xmlString));
 httpRequest.setHeader("Content-Type","application/xml");
 httpRequest.setHeader("Accept","application/xml"); 

 HttpClient httpclient = new DefaultHttpClient();
 HttpResponse httpResponse = httpclient.execute(httpRequest, new BasicHttpContext());

 if (httpResponse.getStatusLine().getStatusCode() == HttpStatus.SC_OK && httpResponse.getEntity() != null) {
 HttpEntity ent = httpResponse.getEntity();
              BufferedReader in = new BufferedReader(new InputStreamReader(ent.getContent()));
              String inputLine;
              while ( (inputLine = in.readLine()) != null) sbf.append(inputLine);
                  in.close();
              EntityUtils.consume(ent);
 } else {
   out.println("error");
}
 %>
<%=sbf.toString() %>
Posted in BusinessObjects 4.0 | Comments Off on BusinessObjects 4.0 RESTful web service proxy

Gmap webi mashup – live example

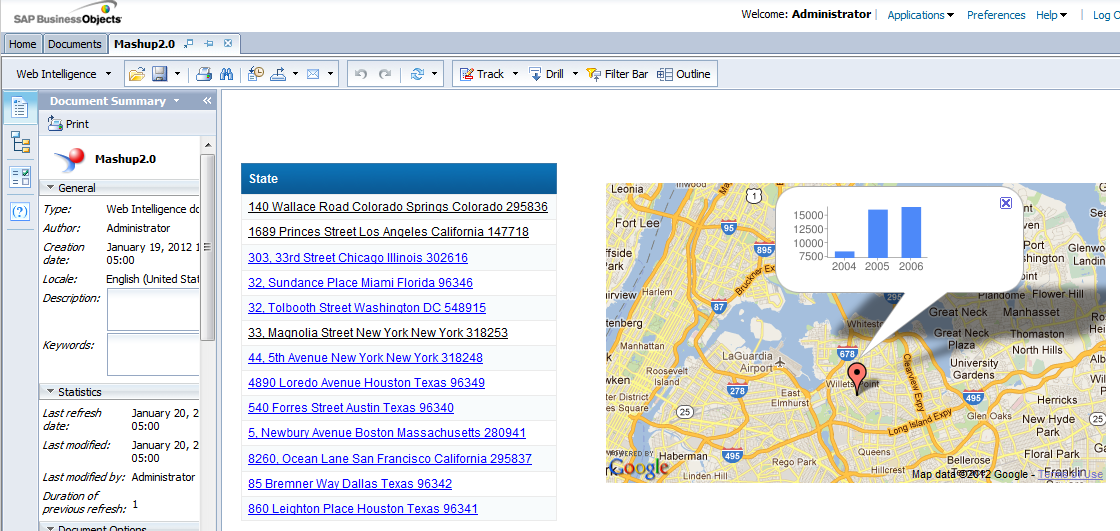
Recently, i received quite a few questions from folks who were trying to deploy my gmap webi mashup example on 4.0. To make the implementation more transparent, i created a LIVE WORKING version, leveraging a BI 4.0 server and some sdk code. Click on the image below to launch the live webi report. You can find all the source code, wid file, etc in the original post.


Posted in BusinessObjects 4.0 | 2 Comments