Custom Logoff page for SAP BI Launchpad

I recently posted about a way to create a custom logon mechanism for SAP BI Launchpad with relatively low effort (some configuration to get an sdk app going, and very little code). Today, i also wanted to share how to configure a custom logoff page for the SAP BI Launchpad. This is much simpler, and requires NO custom coding, just a config file edit (and unfortunately, a web server restart.. :().
To setup a custom logoff page, that users will be redirected to when they log off from the BI Launchpad, locate the BIlaunchpad.properties file (on a typical topmact install, it’s located at: Program Files (x86)\SAP BusinessObjects\Tomcat6\webapps\BOE\WEB-INF\config\default). Before working wth the file, back it up of course. Open the file with a notepad (or some other good text editor that will not mess up the file and leave extra invisible characters in it!) and modify the url.exit= attribute by adding your custom logoff url. Unfortunately, you will need to restart your web server (Tomcat in most cases). After the restart, when you logoff from the BI Launchpad, you will be redirected to the custom page. That’s it! Enjoy.

Posted in BusinessObjects 4.0 | Tagged | 1 Comment

What-if analysis example – HTML5 style

One of the interesting things dashboarding tools and technologies have always been able to do was providing users with the ability to run “what-if” analysis. Changing variables that impact results and allowing users to visualize the impact of the change is a very powerful tool. Using our html5 dashboarding solutions this can be done now on any device with ease. In the example below, you can change the price of the products on the table, and the chart below will reflect the change in the total based on a constant quantity sold. Enjoy.

Posted in BI At Large, Data visualization, HTML5 | Tagged , , | Comments Off on What-if analysis example – HTML5 style

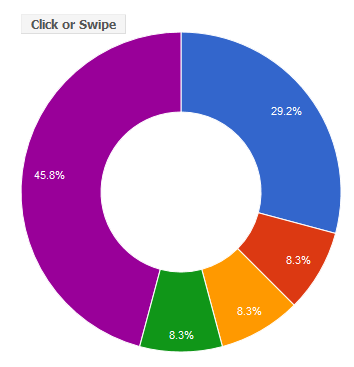
Click or swipe

Once of the clear advantages html5 has over native apps is the concept of develop once, deploy anywhere. From an enterprise IT perspective, this is a huge benefit of course, handling a single code base, leveraging a single development platform, and supporting any kind of device for viewing. As a quick illustration of this concept, i created this simple example that demonstrates how our html5 dashboarding solution can be consumed differently depending on the medium used to display them, using the same code base. On a computer, you can click the “Click or swipe” button with your mouse to switch the chart. However, if you are viewing this page on a mobile device, such as an iPhone, an iPad, or some other mobile phone that supports swipe gestures, you can swipe left and right to switch the chart. This makes me BI Happy 🙂

Posted in BI At Large, Data visualization, HTML5 | Tagged | 4 Comments

Flash style transition effects with HTML5 dashboards

Adding some flash style fade effect to our HTML5 dashboards is a synch… Can control the transition type, speed, and control every aspect of the transition invocation..


Posted in BI At Large, HTML5 | Tagged | 1 Comment

Custom logon page for (SAP BI) BusinessObjects 4.x

If you are looking to customize the way your users login to your BO 4.0 system, a good place to start is the WEB-INF\internal directory in the new BOE webapp structure. It lists the different applications equinox plugin references, and can provide clues into many hidden pathways. If you examine the “BIlaunchpad.properties” file, you will find the reference to the external login methods:

What this spells out, is that essentially, the same paths that worked for 3.x will work for 4.x with minor mods. One technique to create your completely custom logon page, is to collect the user credentials, and the redirect to a procedure that generates en enterprise token, and pass it to the start.do process. The code below is an example of such a process using a simple jsp file. Enjoy your custom login page…

<%@ page language="java" contentType="text/html; charset=ISO-8859-1"
    pageEncoding="ISO-8859-1"%>
    <%@ page import="com.crystaldecisions.sdk.framework.IEnterpriseSession,
com.crystaldecisions.sdk.framework.CrystalEnterprise,
com.crystaldecisions.sdk.exception.SDKException, com.crystaldecisions.sdk.framework.ISessionMgr,
com.crystaldecisions.sdk.occa.security.ILogonTokenMgr, com.crystaldecisions.sdk.occa.security.IUserInfo,
com.businessobjects.bcm.*" %>
<%
try{
    String username = "Administrator";
    String password = "YOUR PASSWORD";
    String cms = "CMS:PORT";
    String authType = "secEnterprise";
    String BOEHost = "BOEHOST:PORT";
    String token = "";
      IEnterpriseSession enterpriseSession = CrystalEnterprise.getSessionMgr().logon(username, password, cms, authType);
      ILogonTokenMgr tokenMgr = enterpriseSession.getLogonTokenMgr();
      token = tokenMgr.getDefaultToken();
      session.setAttribute("token",token);
      response.sendRedirect("http://"+BOEHost+"/BOE/BI/logon/start.do?ivsLogonToken="+token);
      }
      catch(Exception e){
      out.println(new java.util.Date()+": error occured: "+e);
      }
%>
Posted in BusinessObjects 4.0 | Tagged | 87 Comments

Live HTML5 Medicare Dashboard – redux

Please checkout the latest updates to our live html5 medicare dashboard: http://blog.cleartelligence.com/data/topchart.html

The latest version include sparklines and improved select menu UI… Compare the html5 version to the Xcelsius version (http://blog.cleartelligence.com/data/ma-enrollment-dashboard.html), and tell us what you think (of course, don’t try to do the comparison on an iPad, it’s not fair…)

Posted in Data visualization, HTML5 | Tagged , | 6 Comments

Tree menu with dynamic variable number of charts

A sophisticated data visualization UI often requires dynamic placement of elements on the screen. For example, menus may need to be data driven based on hierarchical data that can be ragged or unpredictable. In the example below, you can see how we can leverage our new HTML5 capabilities to dynamically generate collapsible tree nodes of variable length to accommodate any number of charts, on a three rows greed. Of course, this looks just as good on any device or browser…

Posted in BI At Large, Data visualization | Tagged , | 1 Comment

Animated layered charts

Over the last few weeks i have been working with my colleagues at Cleartelligence on our html5 businessobjects dashboarding offering, and boy, does it look good! I managed to surface up and get some air this evening, and thought i’d post a little example of the kind of visual capabilities we will put at the hands of BO clients.

Being able to layer charts is an important way to articulate a comparison between two data sets. While  side by side comparison is typically adequate, in some cases, you just wish you could place two charts on top of each other to get the real picture, and perhaps add some drama.. Using our solution, this is one of the things you will be able to have.

(OOH, OOH, this works great on my iPhone..!)

Posted in BusinessObjects 4.0, Data visualization | Tagged , , , | 5 Comments

Control the dashboard size in SAP BI Launchpad 4.0

Xcelsius dashboards developers who leverage the BI 4.0 BI Launchpad as the content portal for delivering their work, have long suffered from the sloppy interface between Xcelsius and the portal.
First (and foremost), when you publish an Xcelsius or dashboard object (the .swf) into the BI Launchpad (or InfoView for that matter), you lose control over the canvas size. This means that the dashboard will open in a window the size allowed by the user browser and preferences. The impact on the dashboard design can be devastating, rendeing completely unusable in some extreme situation, or at a minimum less then professional looking, as fonts get “squashed” components overlap, and graphics degrade as they stretch or slim down.
This is nothing new, and has been the same situation since XIR2, through 3.1, and now, with 4.0, the problems still remain.
To have complete control over your dashboard presentation, you really should consider hosting it in a different portal, but that is not always feasible. If you are “stuck” with the BI Launchpad, you can use the following technique to address the problem described above, as well as another, less common problem, related to flash crossdomain restrictions. If your dashboard has live data and is making connections to a web service or xml feed, the web service url will have to be fully qualified in the xlf file. The problem will hit you if any of your users use a variation on the host name you used in your web services url. For example, if you use http://myboserver:8080 and your users use a fully qualified name, or even an IP address to get to the server (http://myboserver.mycompany.com:8080), they will end up with a crossdomain error instead of a working dashboard. To overcome this problem, you need to use a dynamic host name, based on the client request.
To address both problems, you can do the following:
First, add a flash variable connection in your xlf. In my example, I called mine host. Use this host flash variable to create a formula in your model that will concatenate the flash variable value with the rest of your web service url. Flash variables are populated on the swf initialization, and the values will be passed to the model before the web service connections are made.
Next, create a directory on your BO web server (tomcat in most cases) and place a .jsp file in it with the following code:

<%
//Initialize var
String host = "";
//Get the host name from the http request
host = request.getServerName();
//Construct an openDoc URL and pass the host name to the swf. Use this url as the content src of the iframe, where you can set the specific height and width
String url = "http://"+host+"/BOE/OpenDocument/opendoc/openDocument.jsp?iDocID=Abvx6T2dOeZNiF8bWJ11Qfk&sIDType=CUID&lsShost="+host;
%>
<iframe src="<%=url%>" height=630 width=1030 marginheight=0 marginwidth=0 frameborder=0></iframe>

 
Now, create a hyperlink in the BI Launchpad to this file (for example, if your file is called link.jsp, which resides in a folder called links and you wanted to use a relative path, your url would look like this: ../../../../../../links/link.jsp)
That’s it! Your swf is still safely secured in the BO repository, openDoc will only work if the user has logged in properly (or prompt the user to logon if not), so any universe security built into your connection will remain intact, and your dashboard will open using the width and height specified, regardless of the host name the users end up using.

Posted in BusinessObjects 4.0, Xcelsius | Tagged , | 2 Comments

Webi Refresh on open in 4.0

I never quite understood why webi reports save with data by default. Since almost all usage scenarios of webi i have ever encountered involve either viewing reports on demand, or viewing the last scheduled instance, leaving data saved on reports is not only a nuisance, but also a security problem.

Experienced report developers know to purge the report data before saving and set the report option to refresh on open, to assure the reports hits the database when opened.

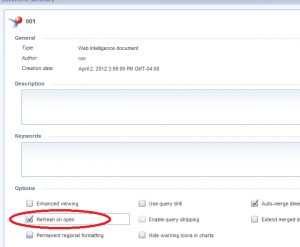
In BI 4.0, the refresh on open option was moved, and i wanted to share its location, since i spent some time finding it myself… So:

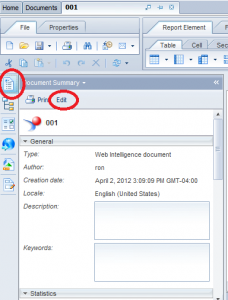
Open your webi report in design mode using the interactive (java) viewer (the rich client works the same, i have not checked the html viewer, i assume it’s located in the same general area…). Click on the report properties button (top button in left toolbar) and then click the Edit button (small button at top)


You will see the option to refresh on open at the bottom of the Edit screen (with some other familiar choices…):


Posted in Web Intelligence | Tagged | 1 Comment